
 Yahoo Finance
 Returns on Capital Paint A Bright Future For GWR Group (ASX:GWR)
If we want to find a stock that could multiply over the long term, what are the underlying trends we should look for? Firstly, we'd want to identify a growing return on capital employed (ROCE) and then alongside that, an ever-increasing base of capital employed. This shows us that it's a compounding machine, able to continually reinvest its earnings back into the business and generate higher returns. Speaking of which, we noticed some great changes in GWR Group's (ASX:GWR) returns on capital, so let's have a look.
Understanding Return On Capital Employed (ROCE)
If you haven't worked with ROCE before, it measures the 'return' (pre-tax profit) a company generates from capital employed in its business. The formula for this calculation on GWR Group is:
Return on Capital Employed = Earnings Before Interest and Tax (EBIT) ÷ (Total Assets - Current Liabilities)
0.36 = AU$8.8m ÷ (AU$49m - AU$24m) (Based on the trailing twelve months to June 2021).
Therefore, GWR Group has an ROCE of 36%. That's a fantastic return and not only that, it outpaces the average of 9.4% earned by companies in a similar industry.
See our latest analysis for GWR Group
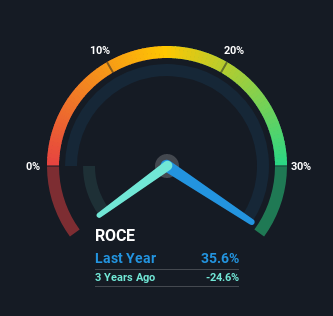
Historical performance is a great place to start when researching a stock so above you can see the gauge for GWR Group's ROCE against it's prior returns. If you want to delve into the historical earnings, revenue and cash flow of GWR Group, check out these free graphs here.
What The Trend Of ROCE Can Tell Us
We're delighted to see that GWR Group is reaping rewards from its investments and is now generating some pre-tax profits. Shareholders would no doubt be pleased with this because the business was loss-making five years ago but is is now generating 36% on its capital. In addition to that, GWR Group is employing 22% more capital than previously which is expected of a company that's trying to break into profitability. We like this trend, because it tells us the company has profitable reinvestment opportunities available to it, and if it continues going forward that can lead to a multi-bagger performance.
On a side note, we noticed that the improvement in ROCE appears to be partly fueled by an increase in current liabilities. Essentially the business now has suppliers or short-term creditors funding about 49% of its operations, which isn't ideal. And with current liabilities at those levels, that's pretty high.
The Bottom Line On GWR Group's ROCE
In summary, it's great to see that GWR Group has managed to break into profitability and is continuing to reinvest in its business. Since the stock has returned a staggering 484% to shareholders over the last five years, it looks like investors are recognizing these changes. With that being said, we still think the promising fundamentals mean the company deserves some further due diligence.
Like most companies, GWR Group does come with some risks, and we've found 3 warning signs that you should be aware of.
If you'd like to see other companies earning high returns, check out our free list of companies earning high returns with solid balance sheets here.
This article by Simply Wall St is general in nature. We provide commentary based on historical data and analyst forecasts only using an unbiased methodology and our articles are not intended to be financial advice. It does not constitute a recommendation to buy or sell any stock, and does not take account of your objectives, or your financial situation. We aim to bring you long-term focused analysis driven by fundamental data. Note that our analysis may not factor in the latest price-sensitive company announcements or qualitative material. Simply Wall St has no position in any stocks mentioned.
Have feedback on this article? Concerned about the content? Get in touch with us directly. Alternatively, email editorial-team (at) simplywallst.com.
