
 Yahoo Finance
 Returns on Capital Paint A Bright Future For Fisher & Paykel Healthcare (NZSE:FPH)
If you're not sure where to start when looking for the next multi-bagger, there are a few key trends you should keep an eye out for. One common approach is to try and find a company with returns on capital employed (ROCE) that are increasing, in conjunction with a growing amount of capital employed. If you see this, it typically means it's a company with a great business model and plenty of profitable reinvestment opportunities. So when we looked at the ROCE trend of Fisher & Paykel Healthcare (NZSE:FPH) we really liked what we saw.
Understanding Return On Capital Employed (ROCE)
If you haven't worked with ROCE before, it measures the 'return' (pre-tax profit) a company generates from capital employed in its business. The formula for this calculation on Fisher & Paykel Healthcare is:
Return on Capital Employed = Earnings Before Interest and Tax (EBIT) ÷ (Total Assets - Current Liabilities)
0.41 = NZ$706m ÷ (NZ$2.0b - NZ$314m) (Based on the trailing twelve months to September 2021).
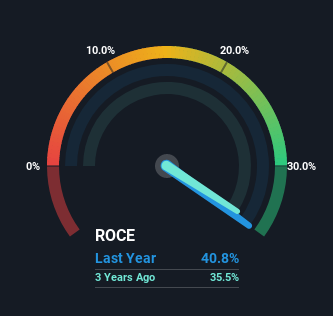
Therefore, Fisher & Paykel Healthcare has an ROCE of 41%. That's a fantastic return and not only that, it outpaces the average of 13% earned by companies in a similar industry.
See our latest analysis for Fisher & Paykel Healthcare
In the above chart we have measured Fisher & Paykel Healthcare's prior ROCE against its prior performance, but the future is arguably more important. If you'd like to see what analysts are forecasting going forward, you should check out our free report for Fisher & Paykel Healthcare.
How Are Returns Trending?
The trends we've noticed at Fisher & Paykel Healthcare are quite reassuring. Over the last five years, returns on capital employed have risen substantially to 41%. The company is effectively making more money per dollar of capital used, and it's worth noting that the amount of capital has increased too, by 157%. This can indicate that there's plenty of opportunities to invest capital internally and at ever higher rates, a combination that's common among multi-baggers.
The Bottom Line On Fisher & Paykel Healthcare's ROCE
A company that is growing its returns on capital and can consistently reinvest in itself is a highly sought after trait, and that's what Fisher & Paykel Healthcare has. And a remarkable 159% total return over the last five years tells us that investors are expecting more good things to come in the future. Therefore, we think it would be worth your time to check if these trends are going to continue.
Like most companies, Fisher & Paykel Healthcare does come with some risks, and we've found 1 warning sign that you should be aware of.
High returns are a key ingredient to strong performance, so check out our free list ofstocks earning high returns on equity with solid balance sheets.
Have feedback on this article? Concerned about the content? Get in touch with us directly. Alternatively, email editorial-team (at) simplywallst.com.
This article by Simply Wall St is general in nature. We provide commentary based on historical data and analyst forecasts only using an unbiased methodology and our articles are not intended to be financial advice. It does not constitute a recommendation to buy or sell any stock, and does not take account of your objectives, or your financial situation. We aim to bring you long-term focused analysis driven by fundamental data. Note that our analysis may not factor in the latest price-sensitive company announcements or qualitative material. Simply Wall St has no position in any stocks mentioned.
