
 Yahoo Finance
 Returns on Capital Paint A Bright Future For IES Holdings (NASDAQ:IESC)
If we want to find a potential multi-bagger, often there are underlying trends that can provide clues. One common approach is to try and find a company with returns on capital employed (ROCE) that are increasing, in conjunction with a growing amount of capital employed. Basically this means that a company has profitable initiatives that it can continue to reinvest in, which is a trait of a compounding machine. Speaking of which, we noticed some great changes in IES Holdings' (NASDAQ:IESC) returns on capital, so let's have a look.
Return On Capital Employed (ROCE): What Is It?
For those who don't know, ROCE is a measure of a company's yearly pre-tax profit (its return), relative to the capital employed in the business. To calculate this metric for IES Holdings, this is the formula:
Return on Capital Employed = Earnings Before Interest and Tax (EBIT) ÷ (Total Assets - Current Liabilities)
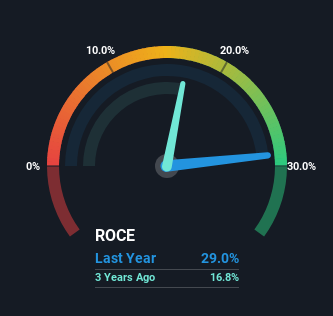
0.29 = US$180m ÷ (US$1.0b - US$422m) (Based on the trailing twelve months to December 2023).
Therefore, IES Holdings has an ROCE of 29%. That's a fantastic return and not only that, it outpaces the average of 13% earned by companies in a similar industry.
Check out our latest analysis for IES Holdings
While the past is not representative of the future, it can be helpful to know how a company has performed historically, which is why we have this chart above. If you're interested in investigating IES Holdings' past further, check out this free graph covering IES Holdings' past earnings, revenue and cash flow.
How Are Returns Trending?
IES Holdings is displaying some positive trends. The numbers show that in the last five years, the returns generated on capital employed have grown considerably to 29%. The company is effectively making more money per dollar of capital used, and it's worth noting that the amount of capital has increased too, by 137%. The increasing returns on a growing amount of capital is common amongst multi-baggers and that's why we're impressed.
Another thing to note, IES Holdings has a high ratio of current liabilities to total assets of 40%. This effectively means that suppliers (or short-term creditors) are funding a large portion of the business, so just be aware that this can introduce some elements of risk. Ideally we'd like to see this reduce as that would mean fewer obligations bearing risks.
In Conclusion...
A company that is growing its returns on capital and can consistently reinvest in itself is a highly sought after trait, and that's what IES Holdings has. And a remarkable 649% total return over the last five years tells us that investors are expecting more good things to come in the future. So given the stock has proven it has promising trends, it's worth researching the company further to see if these trends are likely to persist.
IES Holdings does have some risks though, and we've spotted 1 warning sign for IES Holdings that you might be interested in.
High returns are a key ingredient to strong performance, so check out our free list ofstocks earning high returns on equity with solid balance sheets.
Have feedback on this article? Concerned about the content? Get in touch with us directly. Alternatively, email editorial-team (at) simplywallst.com.
This article by Simply Wall St is general in nature. We provide commentary based on historical data and analyst forecasts only using an unbiased methodology and our articles are not intended to be financial advice. It does not constitute a recommendation to buy or sell any stock, and does not take account of your objectives, or your financial situation. We aim to bring you long-term focused analysis driven by fundamental data. Note that our analysis may not factor in the latest price-sensitive company announcements or qualitative material. Simply Wall St has no position in any stocks mentioned.
