
 Yahoo Finance
 Returns on Capital Paint A Bright Future For Sherwin-Williams (NYSE:SHW)
There are a few key trends to look for if we want to identify the next multi-bagger. One common approach is to try and find a company with returns on capital employed (ROCE) that are increasing, in conjunction with a growing amount of capital employed. If you see this, it typically means it's a company with a great business model and plenty of profitable reinvestment opportunities. With that in mind, the ROCE of Sherwin-Williams (NYSE:SHW) looks great, so lets see what the trend can tell us.
What Is Return On Capital Employed (ROCE)?
Just to clarify if you're unsure, ROCE is a metric for evaluating how much pre-tax income (in percentage terms) a company earns on the capital invested in its business. The formula for this calculation on Sherwin-Williams is:
Return on Capital Employed = Earnings Before Interest and Tax (EBIT) ÷ (Total Assets - Current Liabilities)
0.23 = US$3.6b ÷ (US$23b - US$7.5b) (Based on the trailing twelve months to March 2024).
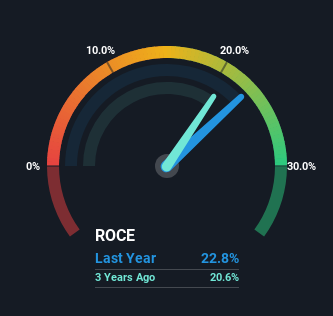
Thus, Sherwin-Williams has an ROCE of 23%. That's a fantastic return and not only that, it outpaces the average of 8.8% earned by companies in a similar industry.
View our latest analysis for Sherwin-Williams
In the above chart we have measured Sherwin-Williams' prior ROCE against its prior performance, but the future is arguably more important. If you'd like, you can check out the forecasts from the analysts covering Sherwin-Williams for free.
How Are Returns Trending?
Sherwin-Williams has not disappointed with their ROCE growth. More specifically, while the company has kept capital employed relatively flat over the last five years, the ROCE has climbed 97% in that same time. So our take on this is that the business has increased efficiencies to generate these higher returns, all the while not needing to make any additional investments. On that front, things are looking good so it's worth exploring what management has said about growth plans going forward.
The Bottom Line
As discussed above, Sherwin-Williams appears to be getting more proficient at generating returns since capital employed has remained flat but earnings (before interest and tax) are up. And with the stock having performed exceptionally well over the last five years, these patterns are being accounted for by investors. In light of that, we think it's worth looking further into this stock because if Sherwin-Williams can keep these trends up, it could have a bright future ahead.
One more thing to note, we've identified 1 warning sign with Sherwin-Williams and understanding this should be part of your investment process.
Sherwin-Williams is not the only stock earning high returns. If you'd like to see more, check out our free list of companies earning high returns on equity with solid fundamentals.
Have feedback on this article? Concerned about the content? Get in touch with us directly. Alternatively, email editorial-team (at) simplywallst.com.
This article by Simply Wall St is general in nature. We provide commentary based on historical data and analyst forecasts only using an unbiased methodology and our articles are not intended to be financial advice. It does not constitute a recommendation to buy or sell any stock, and does not take account of your objectives, or your financial situation. We aim to bring you long-term focused analysis driven by fundamental data. Note that our analysis may not factor in the latest price-sensitive company announcements or qualitative material. Simply Wall St has no position in any stocks mentioned.
Have feedback on this article? Concerned about the content? Get in touch with us directly. Alternatively, email editorial-team@simplywallst.com
