
 Yahoo Finance
 The Returns On Capital At OM Holdings (ASX:OMH) Don't Inspire Confidence
When it comes to investing, there are some useful financial metrics that can warn us when a business is potentially in trouble. Businesses in decline often have two underlying trends, firstly, a declining return on capital employed (ROCE) and a declining base of capital employed. This indicates to us that the business is not only shrinking the size of its net assets, but its returns are falling as well. On that note, looking into OM Holdings (ASX:OMH), we weren't too upbeat about how things were going.
Return On Capital Employed (ROCE): What Is It?
For those that aren't sure what ROCE is, it measures the amount of pre-tax profits a company can generate from the capital employed in its business. Analysts use this formula to calculate it for OM Holdings:
Return on Capital Employed = Earnings Before Interest and Tax (EBIT) ÷ (Total Assets - Current Liabilities)
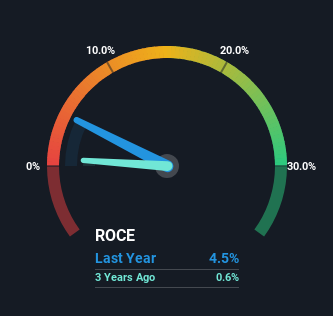
0.045 = US$30m ÷ (US$941m - US$280m) (Based on the trailing twelve months to December 2023).
Thus, OM Holdings has an ROCE of 4.5%. In absolute terms, that's a low return and it also under-performs the Metals and Mining industry average of 11%.
See our latest analysis for OM Holdings
Above you can see how the current ROCE for OM Holdings compares to its prior returns on capital, but there's only so much you can tell from the past. If you'd like, you can check out the forecasts from the analysts covering OM Holdings for free.
What Can We Tell From OM Holdings' ROCE Trend?
In terms of OM Holdings' historical ROCE movements, the trend doesn't inspire confidence. Unfortunately the returns on capital have diminished from the 24% that they were earning five years ago. On top of that, it's worth noting that the amount of capital employed within the business has remained relatively steady. Since returns are falling and the business has the same amount of assets employed, this can suggest it's a mature business that hasn't had much growth in the last five years. So because these trends aren't typically conducive to creating a multi-bagger, we wouldn't hold our breath on OM Holdings becoming one if things continue as they have.
On a side note, OM Holdings' current liabilities have increased over the last five years to 30% of total assets, effectively distorting the ROCE to some degree. If current liabilities hadn't increased as much as they did, the ROCE could actually be even lower. While the ratio isn't currently too high, it's worth keeping an eye on this because if it gets particularly high, the business could then face some new elements of risk.
Our Take On OM Holdings' ROCE
All in all, the lower returns from the same amount of capital employed aren't exactly signs of a compounding machine. Long term shareholders who've owned the stock over the last five years have experienced a 53% depreciation in their investment, so it appears the market might not like these trends either. With underlying trends that aren't great in these areas, we'd consider looking elsewhere.
Since virtually every company faces some risks, it's worth knowing what they are, and we've spotted 4 warning signs for OM Holdings (of which 1 is significant!) that you should know about.
For those who like to invest in solid companies, check out this free list of companies with solid balance sheets and high returns on equity.
Have feedback on this article? Concerned about the content? Get in touch with us directly. Alternatively, email editorial-team (at) simplywallst.com.
This article by Simply Wall St is general in nature. We provide commentary based on historical data and analyst forecasts only using an unbiased methodology and our articles are not intended to be financial advice. It does not constitute a recommendation to buy or sell any stock, and does not take account of your objectives, or your financial situation. We aim to bring you long-term focused analysis driven by fundamental data. Note that our analysis may not factor in the latest price-sensitive company announcements or qualitative material. Simply Wall St has no position in any stocks mentioned.
