
 Yahoo Finance
 Returns On Capital At Exchange Income (TSE:EIF) Have Stalled
What trends should we look for it we want to identify stocks that can multiply in value over the long term? Firstly, we'd want to identify a growing return on capital employed (ROCE) and then alongside that, an ever-increasing base of capital employed. This shows us that it's a compounding machine, able to continually reinvest its earnings back into the business and generate higher returns. However, after investigating Exchange Income (TSE:EIF), we don't think it's current trends fit the mold of a multi-bagger.
Return On Capital Employed (ROCE): What Is It?
For those that aren't sure what ROCE is, it measures the amount of pre-tax profits a company can generate from the capital employed in its business. To calculate this metric for Exchange Income, this is the formula:
Return on Capital Employed = Earnings Before Interest and Tax (EBIT) ÷ (Total Assets - Current Liabilities)
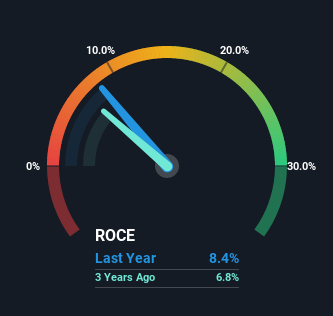
0.084 = CA$253m ÷ (CA$3.6b - CA$525m) (Based on the trailing twelve months to March 2023).
Thus, Exchange Income has an ROCE of 8.4%. In absolute terms, that's a low return but it's around the Airlines industry average of 7.1%.
Check out our latest analysis for Exchange Income
Above you can see how the current ROCE for Exchange Income compares to its prior returns on capital, but there's only so much you can tell from the past. If you're interested, you can view the analysts predictions in our free report on analyst forecasts for the company.
What Does the ROCE Trend For Exchange Income Tell Us?
The returns on capital haven't changed much for Exchange Income in recent years. The company has employed 92% more capital in the last five years, and the returns on that capital have remained stable at 8.4%. Given the company has increased the amount of capital employed, it appears the investments that have been made simply don't provide a high return on capital.
The Bottom Line
As we've seen above, Exchange Income's returns on capital haven't increased but it is reinvesting in the business. Yet to long term shareholders the stock has gifted them an incredible 118% return in the last five years, so the market appears to be rosy about its future. But if the trajectory of these underlying trends continue, we think the likelihood of it being a multi-bagger from here isn't high.
Exchange Income does come with some risks though, we found 3 warning signs in our investment analysis, and 2 of those shouldn't be ignored...
While Exchange Income may not currently earn the highest returns, we've compiled a list of companies that currently earn more than 25% return on equity. Check out this free list here.
Have feedback on this article? Concerned about the content? Get in touch with us directly. Alternatively, email editorial-team (at) simplywallst.com.
This article by Simply Wall St is general in nature. We provide commentary based on historical data and analyst forecasts only using an unbiased methodology and our articles are not intended to be financial advice. It does not constitute a recommendation to buy or sell any stock, and does not take account of your objectives, or your financial situation. We aim to bring you long-term focused analysis driven by fundamental data. Note that our analysis may not factor in the latest price-sensitive company announcements or qualitative material. Simply Wall St has no position in any stocks mentioned.
Join A Paid User Research Session
You’ll receive a US$30 Amazon Gift card for 1 hour of your time while helping us build better investing tools for the individual investors like yourself. Sign up here
