
 Yahoo Finance
 Returns On Capital At DocCheck (ETR:AJ91) Have Hit The Brakes
To find a multi-bagger stock, what are the underlying trends we should look for in a business? Typically, we'll want to notice a trend of growing return on capital employed (ROCE) and alongside that, an expanding base of capital employed. Ultimately, this demonstrates that it's a business that is reinvesting profits at increasing rates of return. With that in mind, the ROCE of DocCheck (ETR:AJ91) looks decent, right now, so lets see what the trend of returns can tell us.
Return On Capital Employed (ROCE): What Is It?
Just to clarify if you're unsure, ROCE is a metric for evaluating how much pre-tax income (in percentage terms) a company earns on the capital invested in its business. To calculate this metric for DocCheck, this is the formula:
Return on Capital Employed = Earnings Before Interest and Tax (EBIT) ÷ (Total Assets - Current Liabilities)
0.17 = €7.4m ÷ (€57m - €13m) (Based on the trailing twelve months to June 2023).
So, DocCheck has an ROCE of 17%. In absolute terms, that's a satisfactory return, but compared to the Healthcare Services industry average of 9.1% it's much better.
View our latest analysis for DocCheck
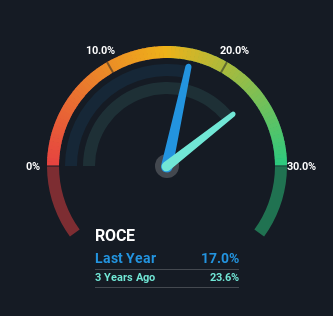
Historical performance is a great place to start when researching a stock so above you can see the gauge for DocCheck's ROCE against it's prior returns. If you want to delve into the historical earnings , check out these free graphs detailing revenue and cash flow performance of DocCheck.
What Does the ROCE Trend For DocCheck Tell Us?
While the returns on capital are good, they haven't moved much. Over the past five years, ROCE has remained relatively flat at around 17% and the business has deployed 120% more capital into its operations. Since 17% is a moderate ROCE though, it's good to see a business can continue to reinvest at these decent rates of return. Over long periods of time, returns like these might not be too exciting, but with consistency they can pay off in terms of share price returns.
The Key Takeaway
To sum it up, DocCheck has simply been reinvesting capital steadily, at those decent rates of return. And given the stock has only risen 32% over the last five years, we'd suspect the market is beginning to recognize these trends. That's why it could be worth your time looking into this stock further to discover if it has more traits of a multi-bagger.
On a final note, we've found 2 warning signs for DocCheck that we think you should be aware of.
While DocCheck may not currently earn the highest returns, we've compiled a list of companies that currently earn more than 25% return on equity. Check out this free list here.
Have feedback on this article? Concerned about the content? Get in touch with us directly. Alternatively, email editorial-team (at) simplywallst.com.
This article by Simply Wall St is general in nature. We provide commentary based on historical data and analyst forecasts only using an unbiased methodology and our articles are not intended to be financial advice. It does not constitute a recommendation to buy or sell any stock, and does not take account of your objectives, or your financial situation. We aim to bring you long-term focused analysis driven by fundamental data. Note that our analysis may not factor in the latest price-sensitive company announcements or qualitative material. Simply Wall St has no position in any stocks mentioned.
