
 Yahoo Finance
 Returns On Capital At Converge Technology Solutions (TSE:CTS) Paint A Concerning Picture
To find a multi-bagger stock, what are the underlying trends we should look for in a business? One common approach is to try and find a company with returns on capital employed (ROCE) that are increasing, in conjunction with a growing amount of capital employed. If you see this, it typically means it's a company with a great business model and plenty of profitable reinvestment opportunities. Having said that, from a first glance at Converge Technology Solutions (TSE:CTS) we aren't jumping out of our chairs at how returns are trending, but let's have a deeper look.
What Is Return On Capital Employed (ROCE)?
Just to clarify if you're unsure, ROCE is a metric for evaluating how much pre-tax income (in percentage terms) a company earns on the capital invested in its business. Analysts use this formula to calculate it for Converge Technology Solutions:
Return on Capital Employed = Earnings Before Interest and Tax (EBIT) ÷ (Total Assets - Current Liabilities)
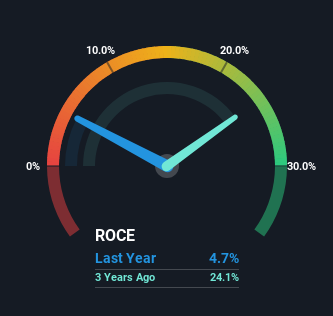
0.047 = CA$53m ÷ (CA$2.2b - CA$1.0b) (Based on the trailing twelve months to September 2023).
Thus, Converge Technology Solutions has an ROCE of 4.7%. In absolute terms, that's a low return and it also under-performs the IT industry average of 12%.
View our latest analysis for Converge Technology Solutions
Above you can see how the current ROCE for Converge Technology Solutions compares to its prior returns on capital, but there's only so much you can tell from the past. If you'd like to see what analysts are forecasting going forward, you should check out our free report for Converge Technology Solutions.
How Are Returns Trending?
On the surface, the trend of ROCE at Converge Technology Solutions doesn't inspire confidence. To be more specific, ROCE has fallen from 37% over the last five years. However, given capital employed and revenue have both increased it appears that the business is currently pursuing growth, at the consequence of short term returns. If these investments prove successful, this can bode very well for long term stock performance.
On a related note, Converge Technology Solutions has decreased its current liabilities to 47% of total assets. That could partly explain why the ROCE has dropped. Effectively this means their suppliers or short-term creditors are funding less of the business, which reduces some elements of risk. Since the business is basically funding more of its operations with it's own money, you could argue this has made the business less efficient at generating ROCE. Keep in mind 47% is still pretty high, so those risks are still somewhat prevalent.
The Key Takeaway
Even though returns on capital have fallen in the short term, we find it promising that revenue and capital employed have both increased for Converge Technology Solutions. And long term investors must be optimistic going forward because the stock has returned a huge 601% to shareholders in the last five years. So while investors seem to be recognizing these promising trends, we would look further into this stock to make sure the other metrics justify the positive view.
Converge Technology Solutions does have some risks though, and we've spotted 1 warning sign for Converge Technology Solutions that you might be interested in.
If you want to search for solid companies with great earnings, check out this free list of companies with good balance sheets and impressive returns on equity.
Have feedback on this article? Concerned about the content? Get in touch with us directly. Alternatively, email editorial-team (at) simplywallst.com.
This article by Simply Wall St is general in nature. We provide commentary based on historical data and analyst forecasts only using an unbiased methodology and our articles are not intended to be financial advice. It does not constitute a recommendation to buy or sell any stock, and does not take account of your objectives, or your financial situation. We aim to bring you long-term focused analysis driven by fundamental data. Note that our analysis may not factor in the latest price-sensitive company announcements or qualitative material. Simply Wall St has no position in any stocks mentioned.
