
 Yahoo Finance
 Returns On Capital At Cadre Holdings (NYSE:CDRE) Have Stalled
What trends should we look for it we want to identify stocks that can multiply in value over the long term? Firstly, we'll want to see a proven return on capital employed (ROCE) that is increasing, and secondly, an expanding base of capital employed. This shows us that it's a compounding machine, able to continually reinvest its earnings back into the business and generate higher returns. That's why when we briefly looked at Cadre Holdings' (NYSE:CDRE) ROCE trend, we were pretty happy with what we saw.
Return On Capital Employed (ROCE): What Is It?
If you haven't worked with ROCE before, it measures the 'return' (pre-tax profit) a company generates from capital employed in its business. To calculate this metric for Cadre Holdings, this is the formula:
Return on Capital Employed = Earnings Before Interest and Tax (EBIT) ÷ (Total Assets - Current Liabilities)
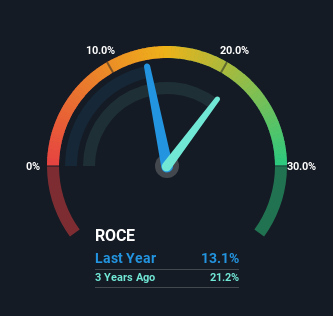
0.13 = US$66m ÷ (US$599m - US$96m) (Based on the trailing twelve months to March 2024).
So, Cadre Holdings has an ROCE of 13%. On its own, that's a standard return, however it's much better than the 9.8% generated by the Aerospace & Defense industry.
Check out our latest analysis for Cadre Holdings
Above you can see how the current ROCE for Cadre Holdings compares to its prior returns on capital, but there's only so much you can tell from the past. If you're interested, you can view the analysts predictions in our free analyst report for Cadre Holdings .
What Can We Tell From Cadre Holdings' ROCE Trend?
While the returns on capital are good, they haven't moved much. The company has consistently earned 13% for the last four years, and the capital employed within the business has risen 111% in that time. Since 13% is a moderate ROCE though, it's good to see a business can continue to reinvest at these decent rates of return. Over long periods of time, returns like these might not be too exciting, but with consistency they can pay off in terms of share price returns.
What We Can Learn From Cadre Holdings' ROCE
To sum it up, Cadre Holdings has simply been reinvesting capital steadily, at those decent rates of return. And the stock has followed suit returning a meaningful 65% to shareholders over the last year. So while the positive underlying trends may be accounted for by investors, we still think this stock is worth looking into further.
If you want to continue researching Cadre Holdings, you might be interested to know about the 3 warning signs that our analysis has discovered.
If you want to search for solid companies with great earnings, check out this free list of companies with good balance sheets and impressive returns on equity.
Have feedback on this article? Concerned about the content? Get in touch with us directly. Alternatively, email editorial-team (at) simplywallst.com.
This article by Simply Wall St is general in nature. We provide commentary based on historical data and analyst forecasts only using an unbiased methodology and our articles are not intended to be financial advice. It does not constitute a recommendation to buy or sell any stock, and does not take account of your objectives, or your financial situation. We aim to bring you long-term focused analysis driven by fundamental data. Note that our analysis may not factor in the latest price-sensitive company announcements or qualitative material. Simply Wall St has no position in any stocks mentioned.
