
 Yahoo Finance
 Returns On Capital At Bravura Solutions (ASX:BVS) Paint A Concerning Picture
What are the early trends we should look for to identify a stock that could multiply in value over the long term? Ideally, a business will show two trends; firstly a growing return on capital employed (ROCE) and secondly, an increasing amount of capital employed. Basically this means that a company has profitable initiatives that it can continue to reinvest in, which is a trait of a compounding machine. However, after briefly looking over the numbers, we don't think Bravura Solutions (ASX:BVS) has the makings of a multi-bagger going forward, but let's have a look at why that may be.
Understanding Return On Capital Employed (ROCE)
For those that aren't sure what ROCE is, it measures the amount of pre-tax profits a company can generate from the capital employed in its business. Analysts use this formula to calculate it for Bravura Solutions:
Return on Capital Employed = Earnings Before Interest and Tax (EBIT) ÷ (Total Assets - Current Liabilities)
0.089 = AU$33m ÷ (AU$450m - AU$81m) (Based on the trailing twelve months to June 2022).
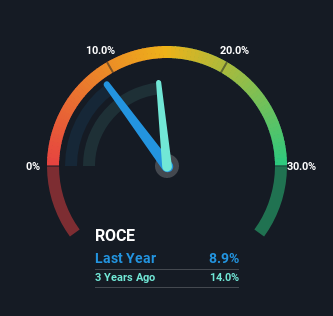
So, Bravura Solutions has an ROCE of 8.9%. Even though it's in line with the industry average of 9.2%, it's still a low return by itself.
Check out our latest analysis for Bravura Solutions
In the above chart we have measured Bravura Solutions' prior ROCE against its prior performance, but the future is arguably more important. If you're interested, you can view the analysts predictions in our free report on analyst forecasts for the company.
What The Trend Of ROCE Can Tell Us
On the surface, the trend of ROCE at Bravura Solutions doesn't inspire confidence. Around five years ago the returns on capital were 22%, but since then they've fallen to 8.9%. However it looks like Bravura Solutions might be reinvesting for long term growth because while capital employed has increased, the company's sales haven't changed much in the last 12 months. It's worth keeping an eye on the company's earnings from here on to see if these investments do end up contributing to the bottom line.
On a side note, Bravura Solutions has done well to pay down its current liabilities to 18% of total assets. That could partly explain why the ROCE has dropped. What's more, this can reduce some aspects of risk to the business because now the company's suppliers or short-term creditors are funding less of its operations. Since the business is basically funding more of its operations with it's own money, you could argue this has made the business less efficient at generating ROCE.
In Conclusion...
To conclude, we've found that Bravura Solutions is reinvesting in the business, but returns have been falling. And investors appear hesitant that the trends will pick up because the stock has fallen 55% in the last five years. In any case, the stock doesn't have these traits of a multi-bagger discussed above, so if that's what you're looking for, we think you'd have more luck elsewhere.
One final note, you should learn about the 2 warning signs we've spotted with Bravura Solutions (including 1 which can't be ignored) .
While Bravura Solutions isn't earning the highest return, check out this free list of companies that are earning high returns on equity with solid balance sheets.
Have feedback on this article? Concerned about the content? Get in touch with us directly. Alternatively, email editorial-team (at) simplywallst.com.
This article by Simply Wall St is general in nature. We provide commentary based on historical data and analyst forecasts only using an unbiased methodology and our articles are not intended to be financial advice. It does not constitute a recommendation to buy or sell any stock, and does not take account of your objectives, or your financial situation. We aim to bring you long-term focused analysis driven by fundamental data. Note that our analysis may not factor in the latest price-sensitive company announcements or qualitative material. Simply Wall St has no position in any stocks mentioned.
Join A Paid User Research Session
You’ll receive a US$30 Amazon Gift card for 1 hour of your time while helping us build better investing tools for the individual investors like yourself. Sign up here
