
 Yahoo Finance
 The Return Trends At Macarthur Minerals (CVE:MMS) Look Promising
If we want to find a stock that could multiply over the long term, what are the underlying trends we should look for? Amongst other things, we'll want to see two things; firstly, a growing return on capital employed (ROCE) and secondly, an expansion in the company's amount of capital employed. This shows us that it's a compounding machine, able to continually reinvest its earnings back into the business and generate higher returns. Speaking of which, we noticed some great changes in Macarthur Minerals' (CVE:MMS) returns on capital, so let's have a look.
Understanding Return On Capital Employed (ROCE)
For those that aren't sure what ROCE is, it measures the amount of pre-tax profits a company can generate from the capital employed in its business. To calculate this metric for Macarthur Minerals, this is the formula:
Return on Capital Employed = Earnings Before Interest and Tax (EBIT) ÷ (Total Assets - Current Liabilities)
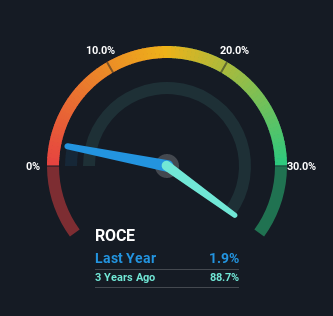
0.019 = AU$1.4m ÷ (AU$78m - AU$2.8m) (Based on the trailing twelve months to March 2022).
Thus, Macarthur Minerals has an ROCE of 1.9%. Even though it's in line with the industry average of 2.4%, it's still a low return by itself.
View our latest analysis for Macarthur Minerals
While the past is not representative of the future, it can be helpful to know how a company has performed historically, which is why we have this chart above. If you want to delve into the historical earnings, revenue and cash flow of Macarthur Minerals, check out these free graphs here.
The Trend Of ROCE
We're delighted to see that Macarthur Minerals is reaping rewards from its investments and is now generating some pre-tax profits. The company was generating losses five years ago, but now it's earning 1.9% which is a sight for sore eyes. In addition to that, Macarthur Minerals is employing 1,124% more capital than previously which is expected of a company that's trying to break into profitability. We like this trend, because it tells us the company has profitable reinvestment opportunities available to it, and if it continues going forward that can lead to a multi-bagger performance.
On a related note, the company's ratio of current liabilities to total assets has decreased to 3.6%, which basically reduces it's funding from the likes of short-term creditors or suppliers. This tells us that Macarthur Minerals has grown its returns without a reliance on increasing their current liabilities, which we're very happy with.
The Bottom Line
Long story short, we're delighted to see that Macarthur Minerals' reinvestment activities have paid off and the company is now profitable. Astute investors may have an opportunity here because the stock has declined 31% in the last five years. That being the case, research into the company's current valuation metrics and future prospects seems fitting.
Like most companies, Macarthur Minerals does come with some risks, and we've found 4 warning signs that you should be aware of.
While Macarthur Minerals isn't earning the highest return, check out this free list of companies that are earning high returns on equity with solid balance sheets.
Have feedback on this article? Concerned about the content? Get in touch with us directly. Alternatively, email editorial-team (at) simplywallst.com.
This article by Simply Wall St is general in nature. We provide commentary based on historical data and analyst forecasts only using an unbiased methodology and our articles are not intended to be financial advice. It does not constitute a recommendation to buy or sell any stock, and does not take account of your objectives, or your financial situation. We aim to bring you long-term focused analysis driven by fundamental data. Note that our analysis may not factor in the latest price-sensitive company announcements or qualitative material. Simply Wall St has no position in any stocks mentioned.
