
 Yahoo Finance
 The Return Trends At Dell Technologies (NYSE:DELL) Look Promising
What are the early trends we should look for to identify a stock that could multiply in value over the long term? Typically, we'll want to notice a trend of growing return on capital employed (ROCE) and alongside that, an expanding base of capital employed. Ultimately, this demonstrates that it's a business that is reinvesting profits at increasing rates of return. With that in mind, we've noticed some promising trends at Dell Technologies (NYSE:DELL) so let's look a bit deeper.
What is Return On Capital Employed (ROCE)?
For those who don't know, ROCE is a measure of a company's yearly pre-tax profit (its return), relative to the capital employed in the business. Analysts use this formula to calculate it for Dell Technologies:
Return on Capital Employed = Earnings Before Interest and Tax (EBIT) ÷ (Total Assets - Current Liabilities)
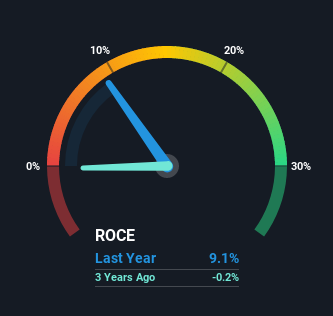
0.091 = US$6.0b ÷ (US$136b - US$70b) (Based on the trailing twelve months to October 2021).
Thus, Dell Technologies has an ROCE of 9.1%. Even though it's in line with the industry average of 9.3%, it's still a low return by itself.
See our latest analysis for Dell Technologies
Above you can see how the current ROCE for Dell Technologies compares to its prior returns on capital, but there's only so much you can tell from the past. If you're interested, you can view the analysts predictions in our free report on analyst forecasts for the company.
How Are Returns Trending?
We're delighted to see that Dell Technologies is reaping rewards from its investments and has now broken into profitability. While the business is profitable now, it used to be incurring losses on invested capital five years ago. In regards to capital employed, Dell Technologies is using 22% less capital than it was five years ago, which on the surface, can indicate that the business has become more efficient at generating these returns. This could potentially mean that the company is selling some of its assets.
On a side note, we noticed that the improvement in ROCE appears to be partly fueled by an increase in current liabilities. Essentially the business now has suppliers or short-term creditors funding about 51% of its operations, which isn't ideal. Given it's pretty high ratio, we'd remind investors that having current liabilities at those levels can bring about some risks in certain businesses.
In Conclusion...
In a nutshell, we're pleased to see that Dell Technologies has been able to generate higher returns from less capital. Since the stock has returned a staggering 139% to shareholders over the last three years, it looks like investors are recognizing these changes. In light of that, we think it's worth looking further into this stock because if Dell Technologies can keep these trends up, it could have a bright future ahead.
If you'd like to know more about Dell Technologies, we've spotted 5 warning signs, and 1 of them is a bit unpleasant.
For those who like to invest in solid companies, check out this free list of companies with solid balance sheets and high returns on equity.
Have feedback on this article? Concerned about the content? Get in touch with us directly. Alternatively, email editorial-team (at) simplywallst.com.
This article by Simply Wall St is general in nature. We provide commentary based on historical data and analyst forecasts only using an unbiased methodology and our articles are not intended to be financial advice. It does not constitute a recommendation to buy or sell any stock, and does not take account of your objectives, or your financial situation. We aim to bring you long-term focused analysis driven by fundamental data. Note that our analysis may not factor in the latest price-sensitive company announcements or qualitative material. Simply Wall St has no position in any stocks mentioned.
