
 Yahoo Finance
 With A Return On Equity Of 7.3%, Has Duke Energy Corporation's (NYSE:DUK) Management Done Well?
While some investors are already well versed in financial metrics (hat tip), this article is for those who would like to learn about Return On Equity (ROE) and why it is important. To keep the lesson grounded in practicality, we'll use ROE to better understand Duke Energy Corporation (NYSE:DUK).
Return on equity or ROE is a key measure used to assess how efficiently a company's management is utilizing the company's capital. In other words, it is a profitability ratio which measures the rate of return on the capital provided by the company's shareholders.
View our latest analysis for Duke Energy
How Is ROE Calculated?
The formula for return on equity is:
Return on Equity = Net Profit (from continuing operations) ÷ Shareholders' Equity
So, based on the above formula, the ROE for Duke Energy is:
7.3% = US$3.8b ÷ US$52b (Based on the trailing twelve months to December 2022).
The 'return' is the yearly profit. One way to conceptualize this is that for each $1 of shareholders' capital it has, the company made $0.07 in profit.
Does Duke Energy Have A Good Return On Equity?
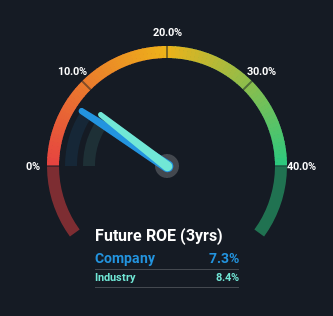
By comparing a company's ROE with its industry average, we can get a quick measure of how good it is. The limitation of this approach is that some companies are quite different from others, even within the same industry classification. If you look at the image below, you can see Duke Energy has a similar ROE to the average in the Electric Utilities industry classification (8.4%).
That's neither particularly good, nor bad. Even if the ROE is respectable when compared to the industry, its worth checking if the firm's ROE is being aided by high debt levels. If a company takes on too much debt, it is at higher risk of defaulting on interest payments. Our risks dashboardshould have the 3 risks we have identified for Duke Energy.
How Does Debt Impact Return On Equity?
Virtually all companies need money to invest in the business, to grow profits. That cash can come from issuing shares, retained earnings, or debt. In the case of the first and second options, the ROE will reflect this use of cash, for growth. In the latter case, the debt used for growth will improve returns, but won't affect the total equity. In this manner the use of debt will boost ROE, even though the core economics of the business stay the same.
Duke Energy's Debt And Its 7.3% ROE
Duke Energy does use a high amount of debt to increase returns. It has a debt to equity ratio of 1.43. Its ROE is quite low, even with the use of significant debt; that's not a good result, in our opinion. Debt increases risk and reduces options for the company in the future, so you generally want to see some good returns from using it.
Conclusion
Return on equity is useful for comparing the quality of different businesses. Companies that can achieve high returns on equity without too much debt are generally of good quality. All else being equal, a higher ROE is better.
But ROE is just one piece of a bigger puzzle, since high quality businesses often trade on high multiples of earnings. It is important to consider other factors, such as future profit growth -- and how much investment is required going forward. So you might want to take a peek at this data-rich interactive graph of forecasts for the company.
But note: Duke Energy may not be the best stock to buy. So take a peek at this free list of interesting companies with high ROE and low debt.
Have feedback on this article? Concerned about the content? Get in touch with us directly. Alternatively, email editorial-team (at) simplywallst.com.
This article by Simply Wall St is general in nature. We provide commentary based on historical data and analyst forecasts only using an unbiased methodology and our articles are not intended to be financial advice. It does not constitute a recommendation to buy or sell any stock, and does not take account of your objectives, or your financial situation. We aim to bring you long-term focused analysis driven by fundamental data. Note that our analysis may not factor in the latest price-sensitive company announcements or qualitative material. Simply Wall St has no position in any stocks mentioned.
Join A Paid User Research Session
You’ll receive a US$30 Amazon Gift card for 1 hour of your time while helping us build better investing tools for the individual investors like yourself. Sign up here
