
 Yahoo Finance
 Resimac Group's (ASX:RMC) earnings growth rate lags the 31% CAGR delivered to shareholders
Resimac Group Limited (ASX:RMC) shareholders might be concerned after seeing the share price drop 27% in the last quarter. But that scarcely detracts from the really solid long term returns generated by the company over five years. In fact, the share price is 235% higher today. So while it's never fun to see a share price fall, it's important to look at a longer time horizon. Of course, that doesn't necessarily mean it's cheap now. While the long term returns are impressive, we do have some sympathy for those who bought more recently, given the 43% drop, in the last year.
While the stock has fallen 13% this week, it's worth focusing on the longer term and seeing if the stocks historical returns have been driven by the underlying fundamentals.
Check out our latest analysis for Resimac Group
There is no denying that markets are sometimes efficient, but prices do not always reflect underlying business performance. One flawed but reasonable way to assess how sentiment around a company has changed is to compare the earnings per share (EPS) with the share price.
During five years of share price growth, Resimac Group achieved compound earnings per share (EPS) growth of 49% per year. The EPS growth is more impressive than the yearly share price gain of 27% over the same period. So it seems the market isn't so enthusiastic about the stock these days. The reasonably low P/E ratio of 5.18 also suggests market apprehension.
You can see below how EPS has changed over time (discover the exact values by clicking on the image).
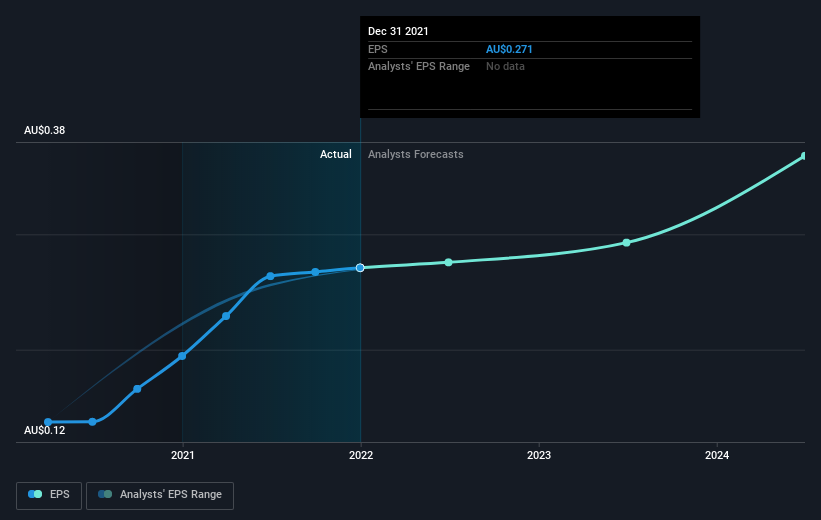
We know that Resimac Group has improved its bottom line over the last three years, but what does the future have in store? It might be well worthwhile taking a look at our free report on how its financial position has changed over time.
What About Dividends?
As well as measuring the share price return, investors should also consider the total shareholder return (TSR). The TSR incorporates the value of any spin-offs or discounted capital raisings, along with any dividends, based on the assumption that the dividends are reinvested. Arguably, the TSR gives a more comprehensive picture of the return generated by a stock. In the case of Resimac Group, it has a TSR of 291% for the last 5 years. That exceeds its share price return that we previously mentioned. This is largely a result of its dividend payments!
A Different Perspective
Resimac Group shareholders are down 40% for the year (even including dividends), but the market itself is up 6.5%. However, keep in mind that even the best stocks will sometimes underperform the market over a twelve month period. On the bright side, long term shareholders have made money, with a gain of 31% per year over half a decade. If the fundamental data continues to indicate long term sustainable growth, the current sell-off could be an opportunity worth considering. I find it very interesting to look at share price over the long term as a proxy for business performance. But to truly gain insight, we need to consider other information, too. Even so, be aware that Resimac Group is showing 2 warning signs in our investment analysis , you should know about...
Of course, you might find a fantastic investment by looking elsewhere. So take a peek at this free list of companies we expect will grow earnings.
Please note, the market returns quoted in this article reflect the market weighted average returns of stocks that currently trade on AU exchanges.
Have feedback on this article? Concerned about the content? Get in touch with us directly. Alternatively, email editorial-team (at) simplywallst.com.
This article by Simply Wall St is general in nature. We provide commentary based on historical data and analyst forecasts only using an unbiased methodology and our articles are not intended to be financial advice. It does not constitute a recommendation to buy or sell any stock, and does not take account of your objectives, or your financial situation. We aim to bring you long-term focused analysis driven by fundamental data. Note that our analysis may not factor in the latest price-sensitive company announcements or qualitative material. Simply Wall St has no position in any stocks mentioned.
