
 Yahoo Finance
 The Reliance Worldwide Corporation Limited (ASX:RWC) Ownership Structure Could Be Important

A look at the shareholders of Reliance Worldwide Corporation Limited (ASX:RWC) can tell us which group is most powerful. Institutions will often hold stock in bigger companies, and we expect to see insiders owning a noticeable percentage of the smaller ones. I quite like to see at least a little bit of insider ownership. As Charlie Munger said ‘Show me the incentive and I will show you the outcome.’
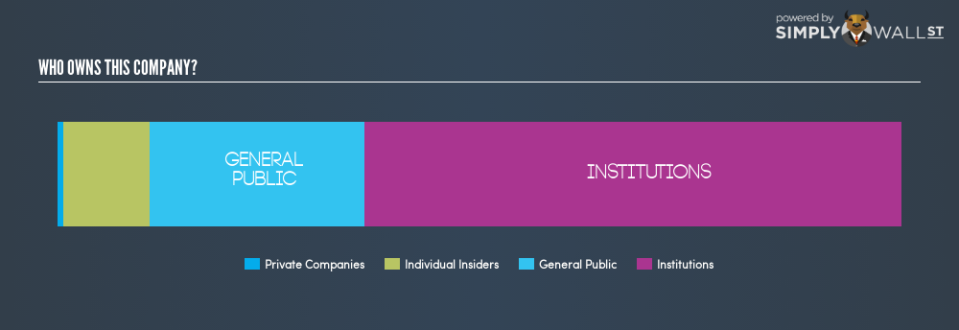
Reliance Worldwide has a market capitalization of AU$4.17b, so it’s too big to fly under the radar. We’d expect to see both institutions and retail investors owning a portion of the company. Taking a look at the our data on the ownership groups (below), it’s seems that institutions are noticeable on the share registry. Let’s delve deeper into each type of owner, to discover more about RWC.
See our latest analysis for Reliance Worldwide
What Does The Institutional Ownership Tell Us About Reliance Worldwide?
Many institutions measure their performance against an index that approximates the local market. So they usually pay more attention to companies that are included in major indices.
We can see that Reliance Worldwide does have institutional investors; and they hold 63.5% of the stock. This suggests some credibility amongst professional investors. But we can’t rely on that fact alone, since institutions make bad investments sometimes, just like everyone does. When multiple institutions own a stock, there’s always a risk that they are in a ‘crowded trade’. When such a trade goes wrong, multiple parties may compete to sell stock fast. This risk is higher in a company without a history of growth. You can see Reliance Worldwide’s historic earnings and revenue, below, but keep in mind there’s always more to the story.

Investors should note that institutions actually own more than half the company, so they can collectively wield significant power. We note that hedge funds don’t have a meaningful investment in Reliance Worldwide. Quite a few analysts cover the stock, so you could look into forecast growth quite easily.
Insider Ownership Of Reliance Worldwide
The definition of company insiders can be subjective, and does vary between jurisdictions. Our data reflects individual insiders, capturing board members at the very least. Company management run the business, but the CEO will answer to the board, even if he or she is a member of it.
Most consider insider ownership a positive because it can indicate the board is well aligned with other shareholders. However, on some occasions too much power is concentrated within this group. Our information suggests that insiders maintain a significant holding in Reliance Worldwide Corporation Limited. It has a market capitalization of just AU$4.17b, and insiders have AU$427.8m worth of shares in their own names. That’s quite significant. Most would be pleased to see the board is investing alongside them. You may wish toaccess this free chart showing recent trading by insiders.
General Public Ownership
With a 25.4% ownership, the general public have some degree of sway over RWC. While this group can’t necessarily call the shots, it can certainly have a real influence on how the company is run.
Next Steps:
It’s always worth thinking about the different groups who own shares in a company. But to understand Reliance Worldwide better, we need to consider many other factors.
I like to dive deeper into how a company has performed in the past. You can find historic revenue and earnings in this detailed graph.
But ultimately it is the future, not the past, that will determine how well the owners of this business will do. Therefore we think it advisable to take a look at this free report showing whether analysts are predicting a brighter future.
NB: Figures in this article are calculated using data from the last twelve months, which refer to the 12-month period ending on the last date of the month the financial statement is dated. This may not be consistent with full year annual report figures.
To help readers see past the short term volatility of the financial market, we aim to bring you a long-term focused research analysis purely driven by fundamental data. Note that our analysis does not factor in the latest price-sensitive company announcements.
The author is an independent contributor and at the time of publication had no position in the stocks mentioned. For errors that warrant correction please contact the editor at editorial-team@simplywallst.com.
