
 Yahoo Finance
 Regions Financial's (RF) Q3 Earnings in Line, Revenues Up
Regions Financial Corporation RF reported third-quarter 2019 adjusted earnings of 39 cents per share, in line with the Zacks Consensus Estimate. Earnings were up 5.4% year over year.
Income from continuing operations available to common shareholders was $385 million compared with the $354 million reported in the year-ago period.
Lower expenses and higher non-interest income were the driving factors. However, lower net interest income due to reduced market-interest rates, were major drags. Additionally, elevated provisions were an undermining factor.
Revenues Up, Costs Drop
Adjusted total revenues (net of interest expense) came in at $1.49 billion in the reported quarter, outpacing the Zacks Consensus Estimate of $1.47 billion. The revenue figure also increased 2.5% from the year-ago quarter’s reported tally.
Regions Financial recorded its highest adjusted pre-tax pre-provision income from continuing operations in a decade of $629 million, up 4% year over year.
On a fully-taxable equivalent (FTE) basis, net interest income was $950 million, down 0.5% year over year. Also, net interest margin (on an FTE basis) shrunk 3 basis points (bps) year over year to 3.44% in the third quarter. Lower market-interest rates and loan balances mainly resulted in this downside. Yet, fall in deposit costs and the benefits of repositioning strategies of the investment portfolio were on the upside.
Non-interest income climbed 7.5% to $558 million. Higher mortgage income, service charges on deposit account, card & ATM fees, commercial credit fee income, wealth management income and other income primarily resulted in this upside. However, these positives were partly offset by lower capital markets income.
Non-interest expense dropped 5.5% year over year to $871 million, mainly due to fall in net occupancy, professional, legal and regulatory expenses, FDIC insurance assessments and other expenses. On an adjusted basis, non-interest expenses escalated 1.4% year over year to $865 million.
Adjusted efficiency ratio came in at 57.4% compared with the prior-year quarter’s 58.1%. A lower ratio indicates a rise in profitability.
Balance-Sheet Strength
As of Sep 30, 2019, adjusted total loans were down 0.7% sequentially to $80.7 billion. Further, total deposits came in at $94 billion, down 0.9%.
As of Sep 30, 2019, low-cost deposits, as a percentage of average deposits, were 91% compared with 93% as of Sep 30, 2018. In addition, deposit costs came in at 49 bps in the September-end quarter.
Credit Quality: A Mixed Bag
Non-performing assets, as a percentage of loans, foreclosed properties and non-performing loans held for sale, shrunk 11 bps from the prior-year quarter to 0.65%. Also, non-accrual loans, excluding loans held for sale, as a percentage of loans, came in at 0.56%, contracting 10 bps year over year.
Allowance for loan losses as a percentage of loans, net of unearned income was 1.05%, up 2 bps from the year-earlier quarter. The company’s total business services criticized loans escalated 15% year over year.
Furthermore, adjusted net charge-offs, as a percentage of average loans, came in at 0.44%, advancing 4 bps. Provision for loan losses was $108 million, up 28.6% from the prior-year quarter.
Strong Capital Position
Regions Financial’s estimated ratios remained well above the regulatory requirements under the Basel III capital rules. As of Sep 30, 2019, Basel III Common Equity Tier 1 ratio (fully phased-in) and Tier 1 capital ratio were estimated at 9.6% and 10.8%, respectively, compared with the 10.2% and 11% recorded in the year-earlier quarter.
During the July-September quarter, Regions repurchased 39.7 million shares of common stock for a total cost of $589 million and announced $150 million in dividends to common shareholders.
Our Viewpoint
Regions Financial put up a decent show in the quarter, backed by top-line strength and improved credit quality to an extent. The company’s favorable funding mix, attractive core business and revenue-diversification strategies will likely yield profitable earnings in the upcoming period.
Though decline in net interest income and loan growth at a sluggish pace pose concerns, we remain optimistic on the company's branch-consolidation plan and expense-reduction moves this year.
Regions Financial Corporation Price, Consensus and EPS Surprise
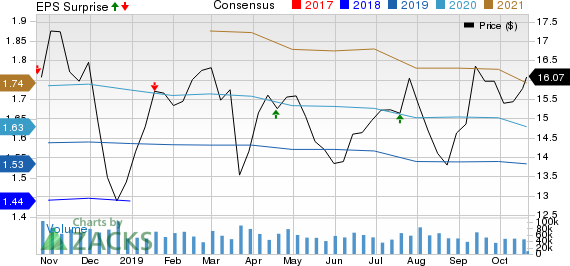
Regions Financial Corporation price-consensus-eps-surprise-chart | Regions Financial Corporation Quote
Currently, Regions Financial carries a Zacks Rank #3 (Hold). You can see the complete list of today’s Zacks #1 Rank (Strong Buy) stocks here.
Performance of Other banks
PNC Financial PNC reported positive earnings surprise of 5% in the third quarter. Earnings per share of $2.94 surpassed the Zacks Consensus Estimate of $2.80. Further, the bottom line reflected a 4.3% jump from the prior-year quarter’s reported figure. Higher revenues, driven by higher net interest income and escalating fee income, aided the company’s results. However, rise in costs and provisions were headwinds.
Goldman Sachs’ GS reported a negative earnings surprise of 4.8% for the September-end period. The company reported earnings per share of $4.79, missing the Zacks Consensus Estimate of $5.03. Further, the bottom-line figure compared unfavorably with earnings of $6.28 per share recorded in the year-earlier quarter.
Wells Fargo’s WFC third-quarter earnings of 92 cents per share lagged the Zacks Consensus Estimate of $1.15 on lower net interest income. The figure also came in lower than the prior-year quarter earnings of $1.13 per share. Results include discrete litigation accrual (not tax-deductible) worth 35 cents per share, and gain from the sale of Institutional Retirement and Trust (IRT) business worth 20 cents. Also, the partial redemption of Series K Preferred Stock decreased earnings by 5 cents.
7 Best Stocks for the Next 30 Days
Just released: Experts distill 7 elite stocks from the current list of 220 Zacks Rank #1 Strong Buys. They deem these tickers “Most Likely for Early Price Pops.”
Since 1988, the full list has beaten the market more than 2X over with an average gain of +24.50% per year. So be sure to give these hand-picked 7 your immediate attention.
See them now >>
Want the latest recommendations from Zacks Investment Research? Today, you can download 7 Best Stocks for the Next 30 Days. Click to get this free report
Wells Fargo & Company (WFC) : Free Stock Analysis Report
The PNC Financial Services Group, Inc (PNC) : Free Stock Analysis Report
Regions Financial Corporation (RF) : Free Stock Analysis Report
The Goldman Sachs Group, Inc. (GS) : Free Stock Analysis Report
To read this article on Zacks.com click here.
Zacks Investment Research
