
 Yahoo Finance
 Reflecting on Metals X's (ASX:MLX) Share Price Returns Over The Last Five Years
Long term investing works well, but it doesn't always work for each individual stock. We don't wish catastrophic capital loss on anyone. Anyone who held Metals X Limited (ASX:MLX) for five years would be nursing their metaphorical wounds since the share price dropped 93% in that time. And we doubt long term believers are the only worried holders, since the stock price has declined 48% over the last twelve months. There was little comfort for shareholders in the last week as the price declined a further 1.2%.
While a drop like that is definitely a body blow, money isn't as important as health and happiness.
View our latest analysis for Metals X
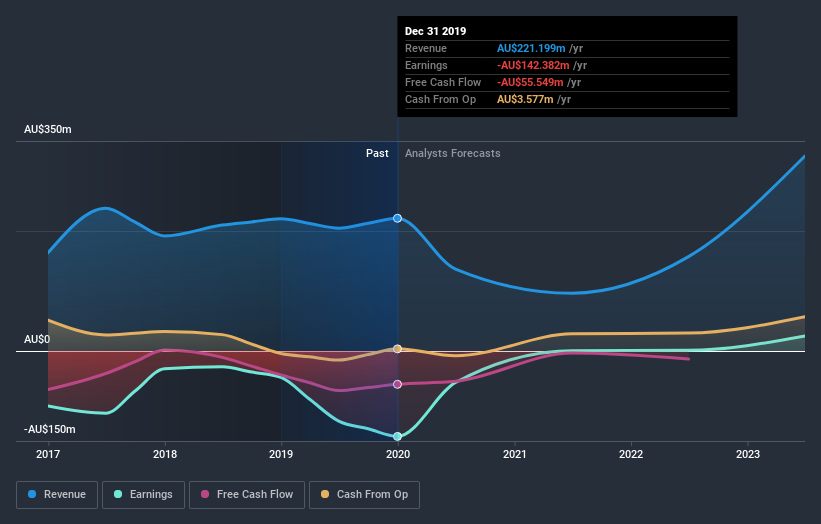
Given that Metals X didn't make a profit in the last twelve months, we'll focus on revenue growth to form a quick view of its business development. When a company doesn't make profits, we'd generally expect to see good revenue growth. Some companies are willing to postpone profitability to grow revenue faster, but in that case one does expect good top-line growth.
In the last five years Metals X saw its revenue shrink by 5.1% per year. While far from catastrophic that is not good. If a business loses money, you want it to grow, so no surprises that the share price has dropped 14% each year in that time. It takes a certain kind of mental fortitude (or recklessness) to buy shares in a company that loses money and doesn't grow revenue. That is not really what the successful investors we know aim for.
The company's revenue and earnings (over time) are depicted in the image below (click to see the exact numbers).
Balance sheet strength is crucial. It might be well worthwhile taking a look at our free report on how its financial position has changed over time.
What about the Total Shareholder Return (TSR)?
Investors should note that there's a difference between Metals X's total shareholder return (TSR) and its share price change, which we've covered above. Arguably the TSR is a more complete return calculation because it accounts for the value of dividends (as if they were reinvested), along with the hypothetical value of any discounted capital that have been offered to shareholders. Its history of dividend payouts mean that Metals X's TSR, which was a 84% drop over the last 5 years, was not as bad as the share price return.
A Different Perspective
We regret to report that Metals X shareholders are down 47% for the year. Unfortunately, that's worse than the broader market decline of 1.4%. However, it could simply be that the share price has been impacted by broader market jitters. It might be worth keeping an eye on the fundamentals, in case there's a good opportunity. Unfortunately, last year's performance may indicate unresolved challenges, given that it was worse than the annualised loss of 13% over the last half decade. Generally speaking long term share price weakness can be a bad sign, though contrarian investors might want to research the stock in hope of a turnaround. It's always interesting to track share price performance over the longer term. But to understand Metals X better, we need to consider many other factors. To that end, you should be aware of the 3 warning signs we've spotted with Metals X .
For those who like to find winning investments this free list of growing companies with recent insider purchasing, could be just the ticket.
Please note, the market returns quoted in this article reflect the market weighted average returns of stocks that currently trade on AU exchanges.
This article by Simply Wall St is general in nature. It does not constitute a recommendation to buy or sell any stock, and does not take account of your objectives, or your financial situation. We aim to bring you long-term focused analysis driven by fundamental data. Note that our analysis may not factor in the latest price-sensitive company announcements or qualitative material. Simply Wall St has no position in any stocks mentioned.
Have feedback on this article? Concerned about the content? Get in touch with us directly. Alternatively, email editorial-team@simplywallst.com.
