
 Yahoo Finance
 The recent US$119m market cap decrease is likely to have disappointed insiders invested in FLEX LNG Ltd. (NYSE:FLNG)
Key Insights
Significant insider control over FLEX LNG implies vested interests in company growth
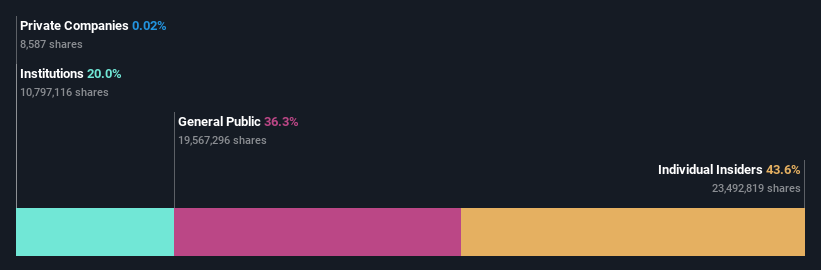
The top 4 shareholders own 50% of the company
Every investor in FLEX LNG Ltd. (NYSE:FLNG) should be aware of the most powerful shareholder groups. We can see that individual insiders own the lion's share in the company with 44% ownership. Put another way, the group faces the maximum upside potential (or downside risk).
And following last week's 7.8% decline in share price, insiders suffered the most losses.
Let's take a closer look to see what the different types of shareholders can tell us about FLEX LNG.
See our latest analysis for FLEX LNG
What Does The Institutional Ownership Tell Us About FLEX LNG?
Many institutions measure their performance against an index that approximates the local market. So they usually pay more attention to companies that are included in major indices.
FLEX LNG already has institutions on the share registry. Indeed, they own a respectable stake in the company. This can indicate that the company has a certain degree of credibility in the investment community. However, it is best to be wary of relying on the supposed validation that comes with institutional investors. They too, get it wrong sometimes. If multiple institutions change their view on a stock at the same time, you could see the share price drop fast. It's therefore worth looking at FLEX LNG's earnings history below. Of course, the future is what really matters.
FLEX LNG is not owned by hedge funds. Our data shows that John Fredriksen is the largest shareholder with 43% of shares outstanding. For context, the second largest shareholder holds about 2.8% of the shares outstanding, followed by an ownership of 2.3% by the third-largest shareholder.
Our research also brought to light the fact that roughly 50% of the company is controlled by the top 4 shareholders suggesting that these owners wield significant influence on the business.
Researching institutional ownership is a good way to gauge and filter a stock's expected performance. The same can be achieved by studying analyst sentiments. There are plenty of analysts covering the stock, so it might be worth seeing what they are forecasting, too.
Insider Ownership Of FLEX LNG
The definition of company insiders can be subjective and does vary between jurisdictions. Our data reflects individual insiders, capturing board members at the very least. Management ultimately answers to the board. However, it is not uncommon for managers to be executive board members, especially if they are a founder or the CEO.
I generally consider insider ownership to be a good thing. However, on some occasions it makes it more difficult for other shareholders to hold the board accountable for decisions.
Our most recent data indicates that insiders own a reasonable proportion of FLEX LNG Ltd.. It is very interesting to see that insiders have a meaningful US$614m stake in this US$1.4b business. It is good to see this level of investment. You can check here to see if those insiders have been buying recently.
General Public Ownership
The general public, who are usually individual investors, hold a 36% stake in FLEX LNG. This size of ownership, while considerable, may not be enough to change company policy if the decision is not in sync with other large shareholders.
Next Steps:
While it is well worth considering the different groups that own a company, there are other factors that are even more important. Take risks for example - FLEX LNG has 2 warning signs we think you should be aware of.
If you would prefer discover what analysts are predicting in terms of future growth, do not miss this free report on analyst forecasts.
NB: Figures in this article are calculated using data from the last twelve months, which refer to the 12-month period ending on the last date of the month the financial statement is dated. This may not be consistent with full year annual report figures.
Have feedback on this article? Concerned about the content? Get in touch with us directly. Alternatively, email editorial-team (at) simplywallst.com.
This article by Simply Wall St is general in nature. We provide commentary based on historical data and analyst forecasts only using an unbiased methodology and our articles are not intended to be financial advice. It does not constitute a recommendation to buy or sell any stock, and does not take account of your objectives, or your financial situation. We aim to bring you long-term focused analysis driven by fundamental data. Note that our analysis may not factor in the latest price-sensitive company announcements or qualitative material. Simply Wall St has no position in any stocks mentioned.
Have feedback on this article? Concerned about the content? Get in touch with us directly. Alternatively, email editorial-team@simplywallst.com
