
 Yahoo Finance
 Recent 6.0% pullback isn't enough to hurt long-term TechnipFMC (NYSE:FTI) shareholders, they're still up 256% over 3 years
It might seem bad, but the worst that can happen when you buy a stock (without leverage) is that its share price goes to zero. But if you buy shares in a really great company, you can more than double your money. For instance the TechnipFMC plc (NYSE:FTI) share price is 253% higher than it was three years ago. That sort of return is as solid as granite. On top of that, the share price is up 33% in about a quarter.
Since the long term performance has been good but there's been a recent pullback of 6.0%, let's check if the fundamentals match the share price.
See our latest analysis for TechnipFMC
While TechnipFMC made a small profit, in the last year, we think that the market is probably more focussed on the top line growth at the moment. As a general rule, we think this kind of company is more comparable to loss-making stocks, since the actual profit is so low. For shareholders to have confidence a company will grow profits significantly, it must grow revenue.
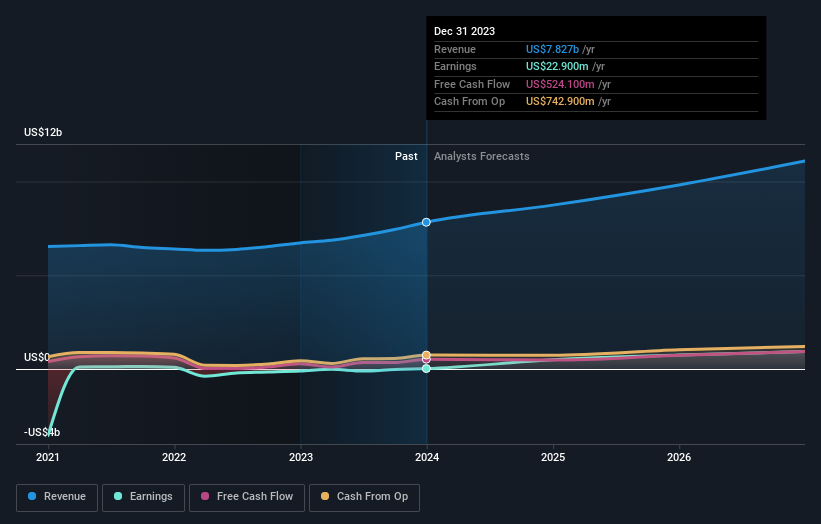
In the last 3 years TechnipFMC saw its revenue grow at 5.2% per year. That's not a very high growth rate considering it doesn't make profits. In comparison, the share price rise of 52% per year over the last three years is pretty impressive. Shareholders should be pretty happy with that, although interested investors might want to examine the financial data more closely to see if the gains are really justified. It seems likely that the market is pretty optimistic about TechnipFMC, given it is losing money.
The graphic below depicts how earnings and revenue have changed over time (unveil the exact values by clicking on the image).
TechnipFMC is a well known stock, with plenty of analyst coverage, suggesting some visibility into future growth. Given we have quite a good number of analyst forecasts, it might be well worth checking out this free chart depicting consensus estimates.
What About Dividends?
As well as measuring the share price return, investors should also consider the total shareholder return (TSR). The TSR is a return calculation that accounts for the value of cash dividends (assuming that any dividend received was reinvested) and the calculated value of any discounted capital raisings and spin-offs. So for companies that pay a generous dividend, the TSR is often a lot higher than the share price return. In the case of TechnipFMC, it has a TSR of 256% for the last 3 years. That exceeds its share price return that we previously mentioned. This is largely a result of its dividend payments!
A Different Perspective
It's good to see that TechnipFMC has rewarded shareholders with a total shareholder return of 89% in the last twelve months. And that does include the dividend. That's better than the annualised return of 8% over half a decade, implying that the company is doing better recently. Someone with an optimistic perspective could view the recent improvement in TSR as indicating that the business itself is getting better with time. While it is well worth considering the different impacts that market conditions can have on the share price, there are other factors that are even more important. Case in point: We've spotted 1 warning sign for TechnipFMC you should be aware of.
For those who like to find winning investments this free list of growing companies with recent insider purchasing, could be just the ticket.
Please note, the market returns quoted in this article reflect the market weighted average returns of stocks that currently trade on American exchanges.
Have feedback on this article? Concerned about the content? Get in touch with us directly. Alternatively, email editorial-team (at) simplywallst.com.
This article by Simply Wall St is general in nature. We provide commentary based on historical data and analyst forecasts only using an unbiased methodology and our articles are not intended to be financial advice. It does not constitute a recommendation to buy or sell any stock, and does not take account of your objectives, or your financial situation. We aim to bring you long-term focused analysis driven by fundamental data. Note that our analysis may not factor in the latest price-sensitive company announcements or qualitative material. Simply Wall St has no position in any stocks mentioned.
