
 Yahoo Finance
 Recent 19% pullback isn't enough to hurt long-term Novonix (ASX:NVX) shareholders, they're still up 254% over 3 years
Novonix Limited (ASX:NVX) shareholders have seen the share price descend 24% over the month. But that doesn't undermine the rather lovely longer-term return, if you measure over the last three years. Indeed, the share price is up a very strong 254% in that time. After a run like that some may not be surprised to see prices moderate. The fundamental business performance will ultimately dictate whether the top is in, or if this is a stellar buying opportunity.
While the stock has fallen 19% this week, it's worth focusing on the longer term and seeing if the stocks historical returns have been driven by the underlying fundamentals.
See our latest analysis for Novonix
Because Novonix made a loss in the last twelve months, we think the market is probably more focussed on revenue and revenue growth, at least for now. Shareholders of unprofitable companies usually expect strong revenue growth. As you can imagine, fast revenue growth, when maintained, often leads to fast profit growth.
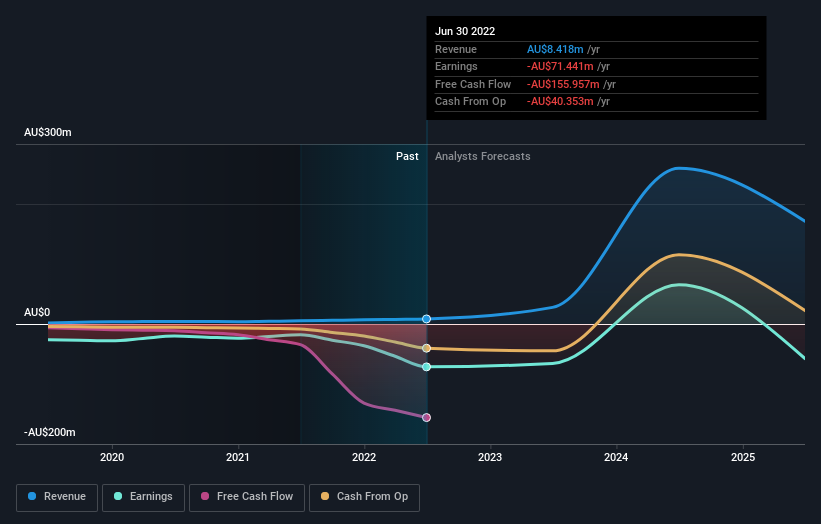
Over the last three years Novonix has grown its revenue at 38% annually. That's much better than most loss-making companies. Meanwhile, the share price performance has been pretty solid at 52% compound over three years. This suggests the market has recognized the progress the business has made, at least to a significant degree. That's not to say we think the share price is too high. In fact, it might be worth keeping an eye on this one.
You can see how earnings and revenue have changed over time in the image below (click on the chart to see the exact values).
This free interactive report on Novonix's balance sheet strength is a great place to start, if you want to investigate the stock further.
A Different Perspective
Investors in Novonix had a tough year, with a total loss of 81%, against a market gain of about 0.2%. However, keep in mind that even the best stocks will sometimes underperform the market over a twelve month period. On the bright side, long term shareholders have made money, with a gain of 14% per year over half a decade. If the fundamental data continues to indicate long term sustainable growth, the current sell-off could be an opportunity worth considering. While it is well worth considering the different impacts that market conditions can have on the share price, there are other factors that are even more important. Case in point: We've spotted 1 warning sign for Novonix you should be aware of.
Of course Novonix may not be the best stock to buy. So you may wish to see this free collection of growth stocks.
Please note, the market returns quoted in this article reflect the market weighted average returns of stocks that currently trade on AU exchanges.
Have feedback on this article? Concerned about the content? Get in touch with us directly. Alternatively, email editorial-team (at) simplywallst.com.
This article by Simply Wall St is general in nature. We provide commentary based on historical data and analyst forecasts only using an unbiased methodology and our articles are not intended to be financial advice. It does not constitute a recommendation to buy or sell any stock, and does not take account of your objectives, or your financial situation. We aim to bring you long-term focused analysis driven by fundamental data. Note that our analysis may not factor in the latest price-sensitive company announcements or qualitative material. Simply Wall St has no position in any stocks mentioned.
Join A Paid User Research Session
You’ll receive a US$30 Amazon Gift card for 1 hour of your time while helping us build better investing tools for the individual investors like yourself. Sign up here
