
 Yahoo Finance
 Recent 11% pullback isn't enough to hurt long-term Tesserent (ASX:TNT) shareholders, they're still up 231% over 3 years
Tesserent Limited (ASX:TNT) shareholders have seen the share price descend 13% over the month. In contrast, the return over three years has been impressive. Indeed, the share price is up a very strong 231% in that time. After a run like that some may not be surprised to see prices moderate. The fundamental business performance will ultimately dictate whether the top is in, or if this is a stellar buying opportunity.
Since the long term performance has been good but there's been a recent pullback of 11%, let's check if the fundamentals match the share price.
Check out our latest analysis for Tesserent
Tesserent wasn't profitable in the last twelve months, it is unlikely we'll see a strong correlation between its share price and its earnings per share (EPS). Arguably revenue is our next best option. When a company doesn't make profits, we'd generally expect to see good revenue growth. That's because it's hard to be confident a company will be sustainable if revenue growth is negligible, and it never makes a profit.
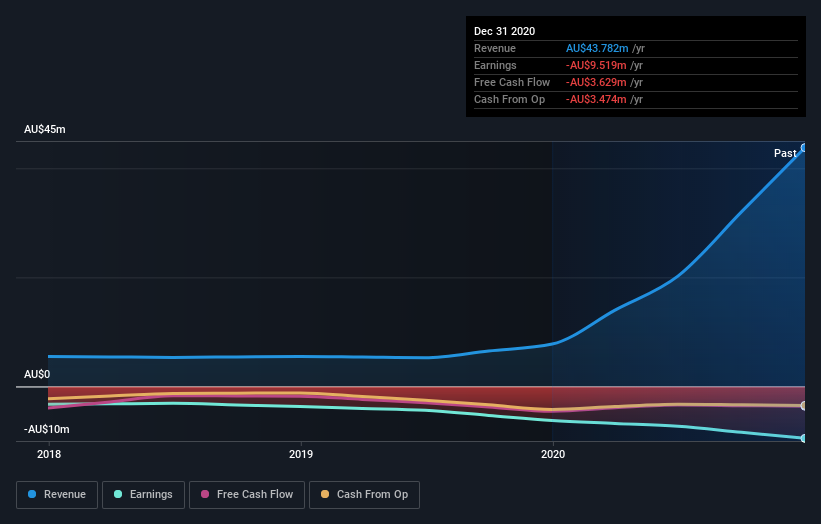
Over the last three years Tesserent has grown its revenue at 80% annually. That's much better than most loss-making companies. Along the way, the share price gained 49% per year, a solid pop by our standards. But it does seem like the market is paying attention to strong revenue growth. That's not to say we think the share price is too high. In fact, it might be worth keeping an eye on this one.
The company's revenue and earnings (over time) are depicted in the image below (click to see the exact numbers).
You can see how its balance sheet has strengthened (or weakened) over time in this free interactive graphic.
A Different Perspective
Tesserent provided a TSR of 4.4% over the last twelve months. But that return falls short of the market. On the bright side, the longer term returns (running at about 17% a year, over half a decade) look better. Maybe the share price is just taking a breather while the business executes on its growth strategy. I find it very interesting to look at share price over the long term as a proxy for business performance. But to truly gain insight, we need to consider other information, too. Take risks, for example - Tesserent has 4 warning signs (and 2 which make us uncomfortable) we think you should know about.
We will like Tesserent better if we see some big insider buys. While we wait, check out this free list of growing companies with considerable, recent, insider buying.
Please note, the market returns quoted in this article reflect the market weighted average returns of stocks that currently trade on AU exchanges.
This article by Simply Wall St is general in nature. We provide commentary based on historical data and analyst forecasts only using an unbiased methodology and our articles are not intended to be financial advice. It does not constitute a recommendation to buy or sell any stock, and does not take account of your objectives, or your financial situation. We aim to bring you long-term focused analysis driven by fundamental data. Note that our analysis may not factor in the latest price-sensitive company announcements or qualitative material. Simply Wall St has no position in any stocks mentioned.
Have feedback on this article? Concerned about the content? Get in touch with us directly. Alternatively, email editorial-team (at) simplywallst.com.
