
 Yahoo Finance
 There Are Reasons To Feel Uneasy About Radius Residential Care's (NZSE:RAD) Returns On Capital
If you're not sure where to start when looking for the next multi-bagger, there are a few key trends you should keep an eye out for. One common approach is to try and find a company with returns on capital employed (ROCE) that are increasing, in conjunction with a growing amount of capital employed. Basically this means that a company has profitable initiatives that it can continue to reinvest in, which is a trait of a compounding machine. However, after investigating Radius Residential Care (NZSE:RAD), we don't think it's current trends fit the mold of a multi-bagger.
Return On Capital Employed (ROCE): What is it?
For those that aren't sure what ROCE is, it measures the amount of pre-tax profits a company can generate from the capital employed in its business. Analysts use this formula to calculate it for Radius Residential Care:
Return on Capital Employed = Earnings Before Interest and Tax (EBIT) ÷ (Total Assets - Current Liabilities)
0.027 = NZ$6.8m ÷ (NZ$272m - NZ$17m) (Based on the trailing twelve months to September 2021).
Thus, Radius Residential Care has an ROCE of 2.7%. On its own that's a low return, but compared to the average of 0.6% generated by the Healthcare industry, it's much better.
View our latest analysis for Radius Residential Care
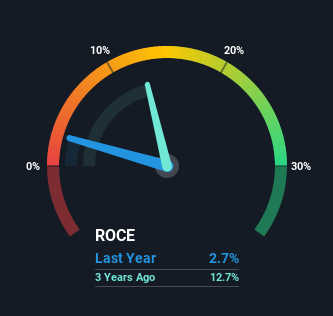
Historical performance is a great place to start when researching a stock so above you can see the gauge for Radius Residential Care's ROCE against it's prior returns. If you'd like to look at how Radius Residential Care has performed in the past in other metrics, you can view this free graph of past earnings, revenue and cash flow.
What Does the ROCE Trend For Radius Residential Care Tell Us?
On the surface, the trend of ROCE at Radius Residential Care doesn't inspire confidence. To be more specific, ROCE has fallen from 17% over the last four years. Meanwhile, the business is utilizing more capital but this hasn't moved the needle much in terms of sales in the past 12 months, so this could reflect longer term investments. It's worth keeping an eye on the company's earnings from here on to see if these investments do end up contributing to the bottom line.
On a related note, Radius Residential Care has decreased its current liabilities to 6.2% of total assets. Since the ratio used to be 58%, that's a significant reduction and it no doubt explains the drop in ROCE. What's more, this can reduce some aspects of risk to the business because now the company's suppliers or short-term creditors are funding less of its operations. Some would claim this reduces the business' efficiency at generating ROCE since it is now funding more of the operations with its own money.
What We Can Learn From Radius Residential Care's ROCE
To conclude, we've found that Radius Residential Care is reinvesting in the business, but returns have been falling. And investors appear hesitant that the trends will pick up because the stock has fallen 56% in the last year. In any case, the stock doesn't have these traits of a multi-bagger discussed above, so if that's what you're looking for, we think you'd have more luck elsewhere.
If you want to know some of the risks facing Radius Residential Care we've found 5 warning signs (3 can't be ignored!) that you should be aware of before investing here.
For those who like to invest in solid companies, check out this free list of companies with solid balance sheets and high returns on equity.
Have feedback on this article? Concerned about the content? Get in touch with us directly. Alternatively, email editorial-team (at) simplywallst.com.
This article by Simply Wall St is general in nature. We provide commentary based on historical data and analyst forecasts only using an unbiased methodology and our articles are not intended to be financial advice. It does not constitute a recommendation to buy or sell any stock, and does not take account of your objectives, or your financial situation. We aim to bring you long-term focused analysis driven by fundamental data. Note that our analysis may not factor in the latest price-sensitive company announcements or qualitative material. Simply Wall St has no position in any stocks mentioned.
