
 Yahoo Finance
 There Are Reasons To Feel Uneasy About CarMax's (NYSE:KMX) Returns On Capital
If you're not sure where to start when looking for the next multi-bagger, there are a few key trends you should keep an eye out for. Firstly, we'll want to see a proven return on capital employed (ROCE) that is increasing, and secondly, an expanding base of capital employed. Basically this means that a company has profitable initiatives that it can continue to reinvest in, which is a trait of a compounding machine. However, after investigating CarMax (NYSE:KMX), we don't think it's current trends fit the mold of a multi-bagger.
Understanding Return On Capital Employed (ROCE)
For those who don't know, ROCE is a measure of a company's yearly pre-tax profit (its return), relative to the capital employed in the business. Analysts use this formula to calculate it for CarMax:
Return on Capital Employed = Earnings Before Interest and Tax (EBIT) ÷ (Total Assets - Current Liabilities)
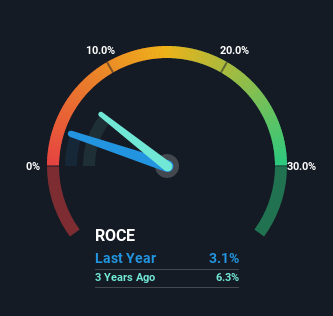
0.031 = US$748m ÷ (US$26b - US$1.9b) (Based on the trailing twelve months to February 2023).
Therefore, CarMax has an ROCE of 3.1%. In absolute terms, that's a low return and it also under-performs the Specialty Retail industry average of 13%.
Check out our latest analysis for CarMax
In the above chart we have measured CarMax's prior ROCE against its prior performance, but the future is arguably more important. If you'd like, you can check out the forecasts from the analysts covering CarMax here for free.
The Trend Of ROCE
On the surface, the trend of ROCE at CarMax doesn't inspire confidence. Over the last five years, returns on capital have decreased to 3.1% from 6.9% five years ago. However it looks like CarMax might be reinvesting for long term growth because while capital employed has increased, the company's sales haven't changed much in the last 12 months. It may take some time before the company starts to see any change in earnings from these investments.
In Conclusion...
Bringing it all together, while we're somewhat encouraged by CarMax's reinvestment in its own business, we're aware that returns are shrinking. Unsurprisingly, the stock has only gained 7.9% over the last five years, which potentially indicates that investors are accounting for this going forward. As a result, if you're hunting for a multi-bagger, we think you'd have more luck elsewhere.
CarMax does have some risks, we noticed 2 warning signs (and 1 which is concerning) we think you should know about.
For those who like to invest in solid companies, check out this free list of companies with solid balance sheets and high returns on equity.
Have feedback on this article? Concerned about the content? Get in touch with us directly. Alternatively, email editorial-team (at) simplywallst.com.
This article by Simply Wall St is general in nature. We provide commentary based on historical data and analyst forecasts only using an unbiased methodology and our articles are not intended to be financial advice. It does not constitute a recommendation to buy or sell any stock, and does not take account of your objectives, or your financial situation. We aim to bring you long-term focused analysis driven by fundamental data. Note that our analysis may not factor in the latest price-sensitive company announcements or qualitative material. Simply Wall St has no position in any stocks mentioned.
Join A Paid User Research Session
You’ll receive a US$30 Amazon Gift card for 1 hour of your time while helping us build better investing tools for the individual investors like yourself. Sign up here