
 Yahoo Finance
 Read This Before Judging CML Group Limited’s (ASX:CGR) ROE

Many investors are still learning about the various metrics that can be useful when analysing a stock. This article is for those who would like to learn about Return On Equity (ROE). We’ll use ROE to examine CML Group Limited (ASX:CGR), by way of a worked example.
CML Group has a ROE of 7.9%, based on the last twelve months. Another way to think of that is that for every A$1 worth of equity in the company, it was able to earn A$0.079.
Check out our latest analysis for CML Group
How Do You Calculate ROE?
The formula for ROE is:
Return on Equity = Net Profit ÷ Shareholders’ Equity
Or for CML Group:
7.9% = 3.186 ÷ AU$40m (Based on the trailing twelve months to June 2018.)
It’s easy to understand the ‘net profit’ part of that equation, but ‘shareholders’ equity’ requires further explanation. It is the capital paid in by shareholders, plus any retained earnings. You can calculate shareholders’ equity by subtracting the company’s total liabilities from its total assets.
What Does ROE Mean?
ROE looks at the amount a company earns relative to the money it has kept within the business. The ‘return’ is the amount earned after tax over the last twelve months. The higher the ROE, the more profit the company is making. So, all else being equal, a high ROE is better than a low one. That means it can be interesting to compare the ROE of different companies.
Does CML Group Have A Good Return On Equity?
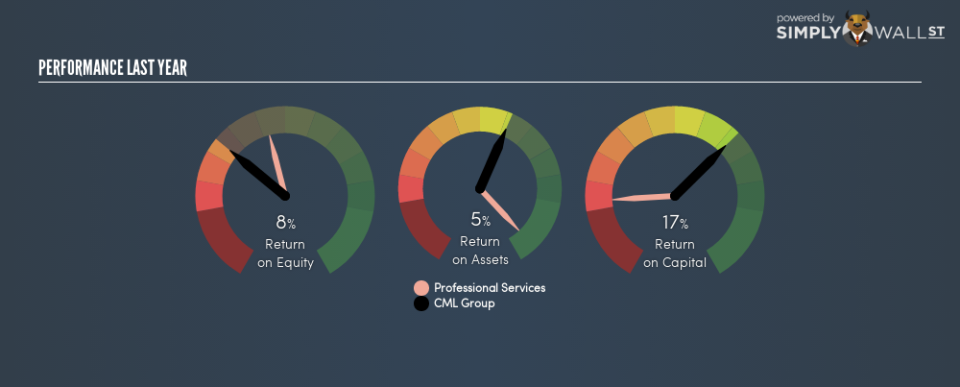
By comparing a company’s ROE with its industry average, we can get a quick measure of how good it is. The limitation of this approach is that some companies are quite different from others, even within the same industry classification. If you look at the image below, you can see CML Group has a lower ROE than the average (14%) in the professional services industry classification.
That certainly isn’t ideal. It is better when the ROE is above industry average, but a low one doesn’t necessarily mean the business is overpriced. Nonetheless, it could be useful to double-check if insiders have sold shares recently.
How Does Debt Impact ROE?
Most companies need money — from somewhere — to grow their profits. That cash can come from retained earnings, issuing new shares (equity), or debt. In the case of the first and second options, the ROE will reflect this use of cash, for growth. In the latter case, the debt required for growth will boost returns, but will not impact the shareholders’ equity. That will make the ROE look better than if no debt was used.
CML Group’s Debt And Its 7.9% ROE
It seems that CML Group uses a lot of debt to fund the business, since it has a high debt to equity ratio of 3.20. Its ROE isn’t that good, despite taking on significant debt, so I don’t find the company attractive on this analysis.
But It’s Just One Metric
Return on equity is one way we can compare the business quality of different companies. In my book the highest quality companies have high return on equity, despite low debt. If two companies have the same ROE, then I would generally prefer the one with less debt.
Having said that, while ROE is a useful indicator of business quality, you’ll have to look at a whole range of factors to determine the right price to buy a stock. It is important to consider other factors, such as future profit growth — and how much investment is required going forward. So I think it may be worth checking this free report on analyst forecasts for the company.
Of course, you might find a fantastic investment by looking elsewhere. So take a peek at this free list of interesting companies.
To help readers see past the short term volatility of the financial market, we aim to bring you a long-term focused research analysis purely driven by fundamental data. Note that our analysis does not factor in the latest price-sensitive company announcements.
The author is an independent contributor and at the time of publication had no position in the stocks mentioned. For errors that warrant correction please contact the editor at editorial-team@simplywallst.com.
