
 Yahoo Finance
 Read This Before You Buy Zenith Energy Limited (ASX:ZEN) Because Of Its P/E Ratio

The goal of this article is to teach you how to use price to earnings ratios (P/E ratios). To keep it practical, we’ll show how Zenith Energy Limited’s (ASX:ZEN) P/E ratio could help you assess the value on offer. Zenith Energy has a P/E ratio of 8.62, based on the last twelve months. In other words, at today’s prices, investors are paying A$8.62 for every A$1 in prior year profit.
View our latest analysis for Zenith Energy
How Do You Calculate A P/E Ratio?
The formula for P/E is:
Price to Earnings Ratio = Share Price ÷ Earnings per Share (EPS)
Or for Zenith Energy:
P/E of 8.62 = A$0.74 ÷ A$0.086 (Based on the trailing twelve months to June 2018.)
Is A High Price-to-Earnings Ratio Good?
A higher P/E ratio means that buyers have to pay a higher price for each A$1 the company has earned over the last year. That isn’t a good or a bad thing on its own, but a high P/E means that buyers have a higher opinion of the business’s prospects, relative to stocks with a lower P/E.
How Growth Rates Impact P/E Ratios
Earnings growth rates have a big influence on P/E ratios. That’s because companies that grow earnings per share quickly will rapidly increase the ‘E’ in the equation. That means even if the current P/E is high, it will reduce over time if the share price stays flat. Then, a lower P/E should attract more buyers, pushing the share price up.
It’s nice to see that Zenith Energy grew EPS by a stonking 47% in the last year.
How Does Zenith Energy’s P/E Ratio Compare To Its Peers?
The P/E ratio essentially measures market expectations of a company. The image below shows that Zenith Energy has a P/E ratio that is roughly in line with the renewable energy industry average (8.7).
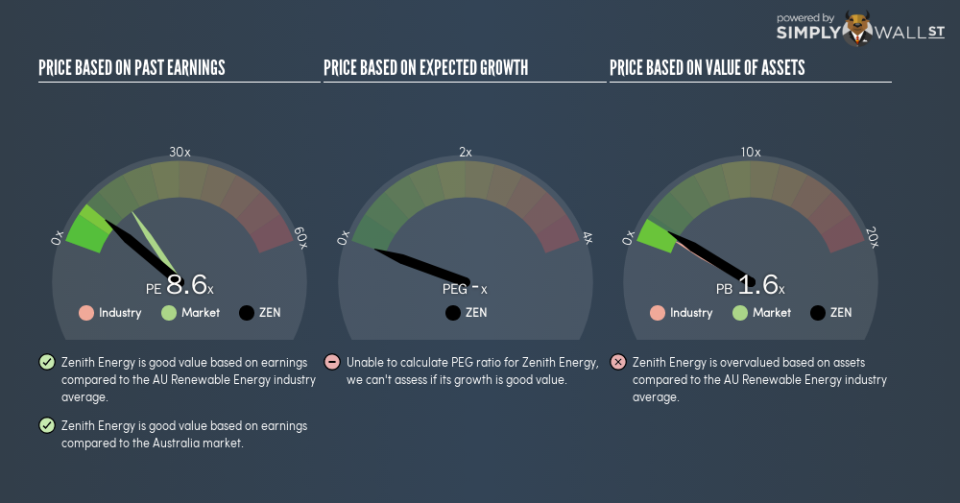
Zenith Energy’s P/E tells us that market participants think its prospects are roughly in line with its industry. If the company has better than average prospects, then the market might be underestimating it. I inform my view byby checking management tenure and remuneration, among other things.
A Limitation: P/E Ratios Ignore Debt and Cash In The Bank
It’s important to note that the P/E ratio considers the market capitalization, not the enterprise value. In other words, it does not consider any debt or cash that the company may have on the balance sheet. Hypothetically, a company could reduce its future P/E ratio by spending its cash (or taking on debt) to achieve higher earnings.
Such spending might be good or bad, overall, but the key point here is that you need to look at debt to understand the P/E ratio in context.
Zenith Energy’s Balance Sheet
Zenith Energy’s net debt is 50% of its market cap. This is enough debt that you’d have to make some adjustments before using the P/E ratio to compare it to a company with net cash.
The Bottom Line On Zenith Energy’s P/E Ratio
Zenith Energy’s P/E is 8.6 which is below average (15.5) in the AU market. The company hasn’t stretched its balance sheet, and earnings growth was good last year. If it continues to grow, then the current low P/E may prove to be unjustified.
Investors have an opportunity when market expectations about a stock are wrong. If the reality for a company is not as bad as the P/E ratio indicates, then the share price should increase as the market realizes this. We don’t have analyst forecasts, but you might want to assess this data-rich visualization of earnings, revenue and cash flow.
But note: Zenith Energy may not be the best stock to buy. So take a peek at this free list of interesting companies with strong recent earnings growth (and a P/E ratio below 20).
To help readers see past the short term volatility of the financial market, we aim to bring you a long-term focused research analysis purely driven by fundamental data. Note that our analysis does not factor in the latest price-sensitive company announcements.
The author is an independent contributor and at the time of publication had no position in the stocks mentioned. For errors that warrant correction please contact the editor at editorial-team@simplywallst.com.
