
 Yahoo Finance
 Read This Before You Buy Prudential plc (LON:PRU) Because Of Its P/E Ratio

Today, we'll introduce the concept of the P/E ratio for those who are learning about investing. We'll show how you can use Prudential plc's (LON:PRU) P/E ratio to inform your assessment of the investment opportunity. Prudential has a P/E ratio of 13.42, based on the last twelve months. That is equivalent to an earnings yield of about 7.5%.
See our latest analysis for Prudential
How Do You Calculate Prudential's P/E Ratio?
The formula for P/E is:
Price to Earnings Ratio = Share Price ÷ Earnings per Share (EPS)
Or for Prudential:
P/E of 13.42 = £13.66 ÷ £1.02 (Based on the year to June 2019.)
Is A High Price-to-Earnings Ratio Good?
A higher P/E ratio implies that investors pay a higher price for the earning power of the business. That isn't a good or a bad thing on its own, but a high P/E means that buyers have a higher opinion of the business's prospects, relative to stocks with a lower P/E.
How Does Prudential's P/E Ratio Compare To Its Peers?
We can get an indication of market expectations by looking at the P/E ratio. You can see in the image below that the average P/E (13.4) for companies in the insurance industry is roughly the same as Prudential's P/E.
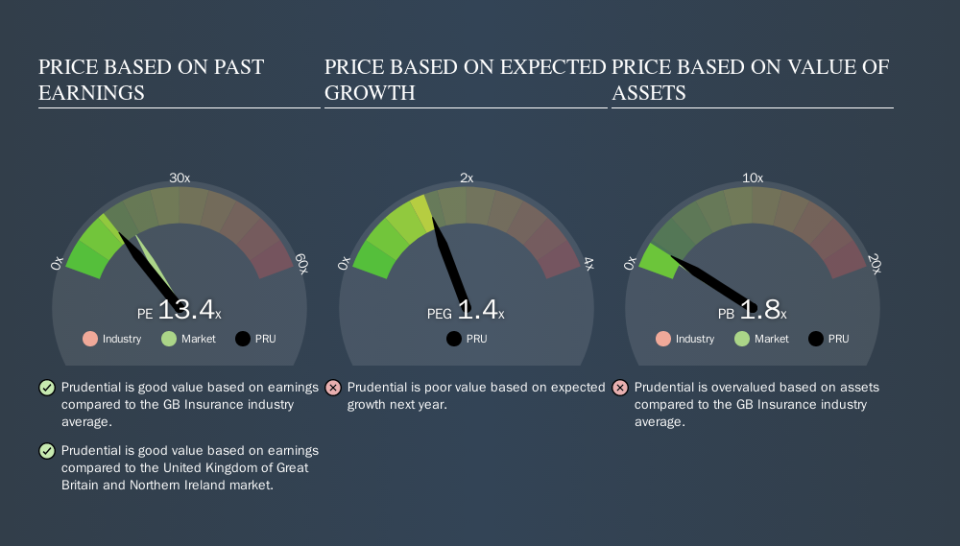
That indicates that the market expects Prudential will perform roughly in line with other companies in its industry. The company could surprise by performing better than average, in the future. I would further inform my view by checking insider buying and selling., among other things.
How Growth Rates Impact P/E Ratios
Generally speaking the rate of earnings growth has a profound impact on a company's P/E multiple. That's because companies that grow earnings per share quickly will rapidly increase the 'E' in the equation. Therefore, even if you pay a high multiple of earnings now, that multiple will become lower in the future. Then, a lower P/E should attract more buyers, pushing the share price up.
Prudential increased earnings per share by an impressive 21% over the last twelve months. And earnings per share have improved by 4.1% annually, over the last five years. With that performance, you might expect an above average P/E ratio.
Don't Forget: The P/E Does Not Account For Debt or Bank Deposits
Don't forget that the P/E ratio considers market capitalization. So it won't reflect the advantage of cash, or disadvantage of debt. The exact same company would hypothetically deserve a higher P/E ratio if it had a strong balance sheet, than if it had a weak one with lots of debt, because a cashed up company can spend on growth.
While growth expenditure doesn't always pay off, the point is that it is a good option to have; but one that the P/E ratio ignores.
So What Does Prudential's Balance Sheet Tell Us?
Net debt is 26% of Prudential's market cap. While that's enough to warrant consideration, it doesn't really concern us.
The Bottom Line On Prudential's P/E Ratio
Prudential has a P/E of 13.4. That's below the average in the GB market, which is 16.8. The EPS growth last year was strong, and debt levels are quite reasonable. If the company can continue to grow earnings, then the current P/E may be unjustifiably low. Since analysts are predicting growth will continue, one might expect to see a higher P/E so it may be worth looking closer.
Investors have an opportunity when market expectations about a stock are wrong. If the reality for a company is not as bad as the P/E ratio indicates, then the share price should increase as the market realizes this. So this free visualization of the analyst consensus on future earnings could help you make the right decision about whether to buy, sell, or hold.
You might be able to find a better buy than Prudential. If you want a selection of possible winners, check out this free list of interesting companies that trade on a P/E below 20 (but have proven they can grow earnings).
We aim to bring you long-term focused research analysis driven by fundamental data. Note that our analysis may not factor in the latest price-sensitive company announcements or qualitative material.
If you spot an error that warrants correction, please contact the editor at editorial-team@simplywallst.com. This article by Simply Wall St is general in nature. It does not constitute a recommendation to buy or sell any stock, and does not take account of your objectives, or your financial situation. Simply Wall St has no position in the stocks mentioned. Thank you for reading.
