
 Yahoo Finance
 Read This Before You Buy East West Bancorp, Inc. (NASDAQ:EWBC) Because Of Its P/E Ratio

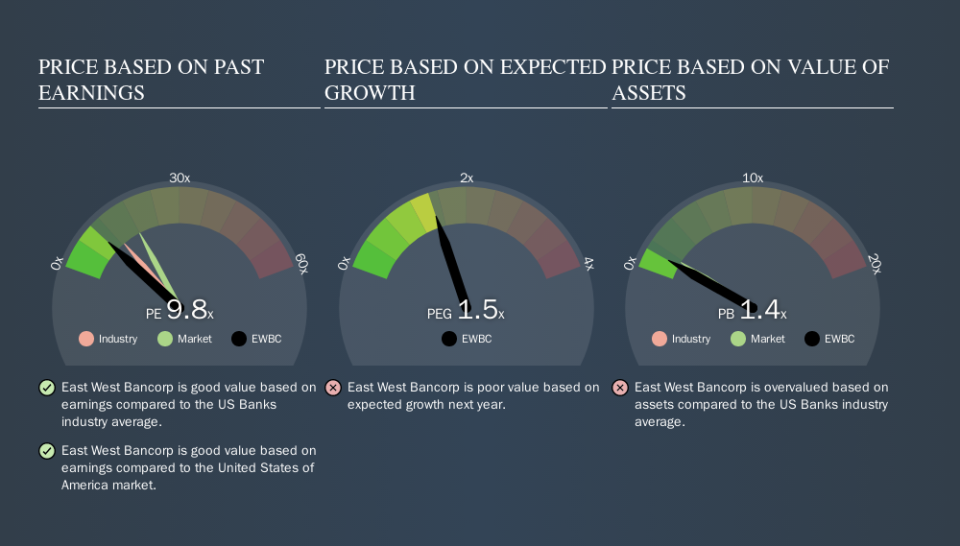
This article is for investors who would like to improve their understanding of price to earnings ratios (P/E ratios). We'll look at East West Bancorp, Inc.'s (NASDAQ:EWBC) P/E ratio and reflect on what it tells us about the company's share price. East West Bancorp has a P/E ratio of 9.78, based on the last twelve months. That corresponds to an earnings yield of approximately 10.2%.
Check out our latest analysis for East West Bancorp
How Do You Calculate A P/E Ratio?
The formula for P/E is:
Price to Earnings Ratio = Price per Share ÷ Earnings per Share (EPS)
Or for East West Bancorp:
P/E of 9.78 = $44.36 ÷ $4.54 (Based on the year to June 2019.)
Is A High Price-to-Earnings Ratio Good?
A higher P/E ratio means that investors are paying a higher price for each $1 of company earnings. That isn't a good or a bad thing on its own, but a high P/E means that buyers have a higher opinion of the business's prospects, relative to stocks with a lower P/E.
Does East West Bancorp Have A Relatively High Or Low P/E For Its Industry?
We can get an indication of market expectations by looking at the P/E ratio. We can see in the image below that the average P/E (12.5) for companies in the banks industry is higher than East West Bancorp's P/E.
East West Bancorp's P/E tells us that market participants think it will not fare as well as its peers in the same industry. Since the market seems unimpressed with East West Bancorp, it's quite possible it could surprise on the upside. You should delve deeper. I like to check if company insiders have been buying or selling.
How Growth Rates Impact P/E Ratios
P/E ratios primarily reflect market expectations around earnings growth rates. Earnings growth means that in the future the 'E' will be higher. Therefore, even if you pay a high multiple of earnings now, that multiple will become lower in the future. A lower P/E should indicate the stock is cheap relative to others -- and that may attract buyers.
It's great to see that East West Bancorp grew EPS by 14% in the last year. And it has bolstered its earnings per share by 16% per year over the last five years. This could arguably justify a relatively high P/E ratio.
A Limitation: P/E Ratios Ignore Debt and Cash In The Bank
It's important to note that the P/E ratio considers the market capitalization, not the enterprise value. In other words, it does not consider any debt or cash that the company may have on the balance sheet. Hypothetically, a company could reduce its future P/E ratio by spending its cash (or taking on debt) to achieve higher earnings.
While growth expenditure doesn't always pay off, the point is that it is a good option to have; but one that the P/E ratio ignores.
Is Debt Impacting East West Bancorp's P/E?
East West Bancorp has net cash of US$3.2b. This is fairly high at 50% of its market capitalization. That might mean balance sheet strength is important to the business, but should also help push the P/E a bit higher than it would otherwise be.
The Bottom Line On East West Bancorp's P/E Ratio
East West Bancorp has a P/E of 9.8. That's below the average in the US market, which is 17.8. It grew its EPS nicely over the last year, and the healthy balance sheet implies there is more potential for growth. The below average P/E ratio suggests that market participants don't believe the strong growth will continue.
Investors have an opportunity when market expectations about a stock are wrong. If the reality for a company is not as bad as the P/E ratio indicates, then the share price should increase as the market realizes this. So this free visualization of the analyst consensus on future earnings could help you make the right decision about whether to buy, sell, or hold.
You might be able to find a better buy than East West Bancorp. If you want a selection of possible winners, check out this free list of interesting companies that trade on a P/E below 20 (but have proven they can grow earnings).
We aim to bring you long-term focused research analysis driven by fundamental data. Note that our analysis may not factor in the latest price-sensitive company announcements or qualitative material.
If you spot an error that warrants correction, please contact the editor at editorial-team@simplywallst.com. This article by Simply Wall St is general in nature. It does not constitute a recommendation to buy or sell any stock, and does not take account of your objectives, or your financial situation. Simply Wall St has no position in the stocks mentioned. Thank you for reading.
