
 Yahoo Finance
 REA Group (ASX:REA) Is Aiming To Keep Up Its Impressive Returns
What trends should we look for it we want to identify stocks that can multiply in value over the long term? Ideally, a business will show two trends; firstly a growing return on capital employed (ROCE) and secondly, an increasing amount of capital employed. Put simply, these types of businesses are compounding machines, meaning they are continually reinvesting their earnings at ever-higher rates of return. With that in mind, the ROCE of REA Group (ASX:REA) looks attractive right now, so lets see what the trend of returns can tell us.
Return On Capital Employed (ROCE): What is it?
Just to clarify if you're unsure, ROCE is a metric for evaluating how much pre-tax income (in percentage terms) a company earns on the capital invested in its business. Analysts use this formula to calculate it for REA Group:
Return on Capital Employed = Earnings Before Interest and Tax (EBIT) ÷ (Total Assets - Current Liabilities)
0.25 = AU$527m ÷ (AU$2.4b - AU$290m) (Based on the trailing twelve months to December 2021).
Therefore, REA Group has an ROCE of 25%. In absolute terms that's a great return and it's even better than the Interactive Media and Services industry average of 9.0%.
View our latest analysis for REA Group
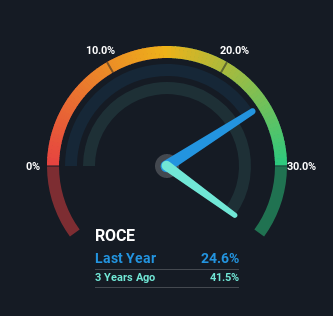
Above you can see how the current ROCE for REA Group compares to its prior returns on capital, but there's only so much you can tell from the past. If you'd like to see what analysts are forecasting going forward, you should check out our free report for REA Group.
How Are Returns Trending?
In terms of REA Group's history of ROCE, it's quite impressive. The company has consistently earned 25% for the last five years, and the capital employed within the business has risen 56% in that time. With returns that high, it's great that the business can continually reinvest its money at such appealing rates of return. If REA Group can keep this up, we'd be very optimistic about its future.
What We Can Learn From REA Group's ROCE
REA Group has demonstrated its proficiency by generating high returns on increasing amounts of capital employed, which we're thrilled about. Therefore it's no surprise that shareholders have earned a respectable 89% return if they held over the last five years. So while the positive underlying trends may be accounted for by investors, we still think this stock is worth looking into further.
If you'd like to know about the risks facing REA Group, we've discovered 1 warning sign that you should be aware of.
High returns are a key ingredient to strong performance, so check out our free list ofstocks earning high returns on equity with solid balance sheets.
Have feedback on this article? Concerned about the content? Get in touch with us directly. Alternatively, email editorial-team (at) simplywallst.com.
This article by Simply Wall St is general in nature. We provide commentary based on historical data and analyst forecasts only using an unbiased methodology and our articles are not intended to be financial advice. It does not constitute a recommendation to buy or sell any stock, and does not take account of your objectives, or your financial situation. We aim to bring you long-term focused analysis driven by fundamental data. Note that our analysis may not factor in the latest price-sensitive company announcements or qualitative material. Simply Wall St has no position in any stocks mentioned.
