
 Yahoo Finance
 RBR Group Limited's (ASX:RBR) Stock Is Going Strong: Have Financials A Role To Play?
RBR Group's (ASX:RBR) stock is up by a considerable 13% over the past month. As most would know, fundamentals are what usually guide market price movements over the long-term, so we decided to look at the company's key financial indicators today to determine if they have any role to play in the recent price movement. Specifically, we decided to study RBR Group's ROE in this article.
Return on Equity or ROE is a test of how effectively a company is growing its value and managing investors’ money. In simpler terms, it measures the profitability of a company in relation to shareholder's equity.
See our latest analysis for RBR Group
How To Calculate Return On Equity?
The formula for ROE is:
Return on Equity = Net Profit (from continuing operations) ÷ Shareholders' Equity
So, based on the above formula, the ROE for RBR Group is:
74% = AU$3.6m ÷ AU$4.9m (Based on the trailing twelve months to December 2021).
The 'return' is the profit over the last twelve months. So, this means that for every A$1 of its shareholder's investments, the company generates a profit of A$0.74.
What Is The Relationship Between ROE And Earnings Growth?
So far, we've learned that ROE is a measure of a company's profitability. Depending on how much of these profits the company reinvests or "retains", and how effectively it does so, we are then able to assess a company’s earnings growth potential. Assuming all else is equal, companies that have both a higher return on equity and higher profit retention are usually the ones that have a higher growth rate when compared to companies that don't have the same features.
RBR Group's Earnings Growth And 74% ROE
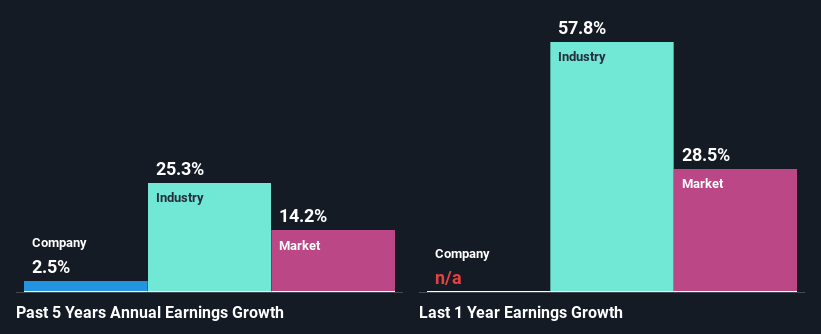
Firstly, we acknowledge that RBR Group has a significantly high ROE. Second, a comparison with the average ROE reported by the industry of 16% also doesn't go unnoticed by us. Despite this, RBR Group's five year net income growth was quite low averaging at only 2.5%. This is interesting as the high returns should mean that the company has the ability to generate high growth but for some reason, it hasn't been able to do so. We reckon that a low growth, when returns are quite high could be the result of certain circumstances like low earnings retention or or poor allocation of capital.
We then compared RBR Group's net income growth with the industry and found that the company's growth figure is lower than the average industry growth rate of 25% in the same period, which is a bit concerning.
Earnings growth is an important metric to consider when valuing a stock. It’s important for an investor to know whether the market has priced in the company's expected earnings growth (or decline). By doing so, they will have an idea if the stock is headed into clear blue waters or if swampy waters await. If you're wondering about RBR Group's's valuation, check out this gauge of its price-to-earnings ratio, as compared to its industry.
Is RBR Group Making Efficient Use Of Its Profits?
RBR Group doesn't pay any dividend, which means that it is retaining all of its earnings. However, there's only been very little earnings growth to show for it. So there might be other factors at play here which could potentially be hampering growth. For example, the business has faced some headwinds.
Summary
On the whole, we do feel that RBR Group has some positive attributes. Yet, the low earnings growth is a bit concerning, especially given that the company has a high rate of return and is reinvesting ma huge portion of its profits. By the looks of it, there could be some other factors, not necessarily in control of the business, that's preventing growth. While we won't completely dismiss the company, what we would do, is try to ascertain how risky the business is to make a more informed decision around the company. Our risks dashboard would have the 3 risks we have identified for RBR Group.
Have feedback on this article? Concerned about the content? Get in touch with us directly. Alternatively, email editorial-team (at) simplywallst.com.
This article by Simply Wall St is general in nature. We provide commentary based on historical data and analyst forecasts only using an unbiased methodology and our articles are not intended to be financial advice. It does not constitute a recommendation to buy or sell any stock, and does not take account of your objectives, or your financial situation. We aim to bring you long-term focused analysis driven by fundamental data. Note that our analysis may not factor in the latest price-sensitive company announcements or qualitative material. Simply Wall St has no position in any stocks mentioned.
