
 Yahoo Finance
 What Is RBC Bearings's (NASDAQ:ROLL) P/E Ratio After Its Share Price Tanked?

To the annoyance of some shareholders, RBC Bearings (NASDAQ:ROLL) shares are down a considerable 32% in the last month. The recent drop has obliterated the annual return, with the share price now down 5.1% over that longer period.
All else being equal, a share price drop should make a stock more attractive to potential investors. While the market sentiment towards a stock is very changeable, in the long run, the share price will tend to move in the same direction as earnings per share. So, on certain occasions, long term focussed investors try to take advantage of pessimistic expectations to buy shares at a better price. One way to gauge market expectations of a stock is to look at its Price to Earnings Ratio (PE Ratio). Investors have optimistic expectations of companies with higher P/E ratios, compared to companies with lower P/E ratios.
View our latest analysis for RBC Bearings
Does RBC Bearings Have A Relatively High Or Low P/E For Its Industry?
We can tell from its P/E ratio of 23.98 that there is some investor optimism about RBC Bearings. The image below shows that RBC Bearings has a higher P/E than the average (15.7) P/E for companies in the machinery industry.
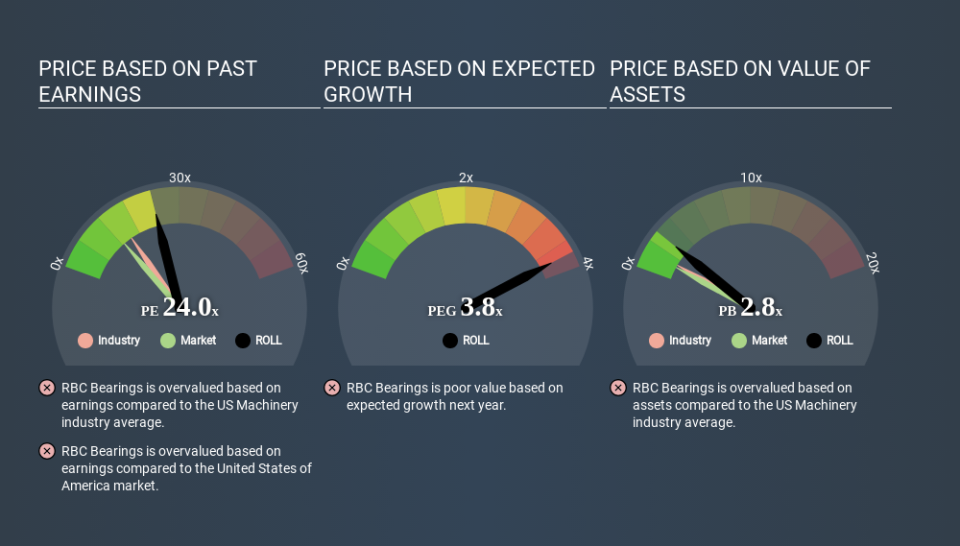
RBC Bearings's P/E tells us that market participants think the company will perform better than its industry peers, going forward. Clearly the market expects growth, but it isn't guaranteed. So further research is always essential. I often monitor director buying and selling.
How Growth Rates Impact P/E Ratios
Earnings growth rates have a big influence on P/E ratios. If earnings are growing quickly, then the 'E' in the equation will increase faster than it would otherwise. And in that case, the P/E ratio itself will drop rather quickly. And as that P/E ratio drops, the company will look cheap, unless its share price increases.
It's great to see that RBC Bearings grew EPS by 21% in the last year. And its annual EPS growth rate over 5 years is 14%. This could arguably justify a relatively high P/E ratio.
Don't Forget: The P/E Does Not Account For Debt or Bank Deposits
It's important to note that the P/E ratio considers the market capitalization, not the enterprise value. In other words, it does not consider any debt or cash that the company may have on the balance sheet. Hypothetically, a company could reduce its future P/E ratio by spending its cash (or taking on debt) to achieve higher earnings.
Such expenditure might be good or bad, in the long term, but the point here is that the balance sheet is not reflected by this ratio.
How Does RBC Bearings's Debt Impact Its P/E Ratio?
The extra options and safety that comes with RBC Bearings's US$38m net cash position means that it deserves a higher P/E than it would if it had a lot of net debt.
The Bottom Line On RBC Bearings's P/E Ratio
RBC Bearings trades on a P/E ratio of 24.0, which is above its market average of 13.4. Its strong balance sheet gives the company plenty of resources for extra growth, and it has already proven it can grow. So it is not surprising the market is probably extrapolating recent growth well into the future, reflected in the relatively high P/E ratio. Given RBC Bearings's P/E ratio has declined from 35.2 to 24.0 in the last month, we know for sure that the market is significantly less confident about the business today, than it was back then. For those who prefer to invest with the flow of momentum, that might be a bad sign, but for a contrarian, it may signal opportunity.
When the market is wrong about a stock, it gives savvy investors an opportunity. People often underestimate remarkable growth -- so investors can make money when fast growth is not fully appreciated. So this free report on the analyst consensus forecasts could help you make a master move on this stock.
But note: RBC Bearings may not be the best stock to buy. So take a peek at this free list of interesting companies with strong recent earnings growth (and a P/E ratio below 20).
If you spot an error that warrants correction, please contact the editor at editorial-team@simplywallst.com. This article by Simply Wall St is general in nature. It does not constitute a recommendation to buy or sell any stock, and does not take account of your objectives, or your financial situation. Simply Wall St has no position in the stocks mentioned.
We aim to bring you long-term focused research analysis driven by fundamental data. Note that our analysis may not factor in the latest price-sensitive company announcements or qualitative material. Thank you for reading.
