
 Yahoo Finance
 Should You Like RBC Bearings Incorporated’s (NASDAQ:ROLL) High Return On Capital Employed?

Today we are going to look at RBC Bearings Incorporated (NASDAQ:ROLL) to see whether it might be an attractive investment prospect. To be precise, we'll consider its Return On Capital Employed (ROCE), as that will inform our view of the quality of the business.
First, we'll go over how we calculate ROCE. Second, we'll look at its ROCE compared to similar companies. Then we'll determine how its current liabilities are affecting its ROCE.
Return On Capital Employed (ROCE): What is it?
ROCE measures the amount of pre-tax profits a company can generate from the capital employed in its business. Generally speaking a higher ROCE is better. In brief, it is a useful tool, but it is not without drawbacks. Author Edwin Whiting says to be careful when comparing the ROCE of different businesses, since 'No two businesses are exactly alike.'
How Do You Calculate Return On Capital Employed?
The formula for calculating the return on capital employed is:
Return on Capital Employed = Earnings Before Interest and Tax (EBIT) ÷ (Total Assets - Current Liabilities)
Or for RBC Bearings:
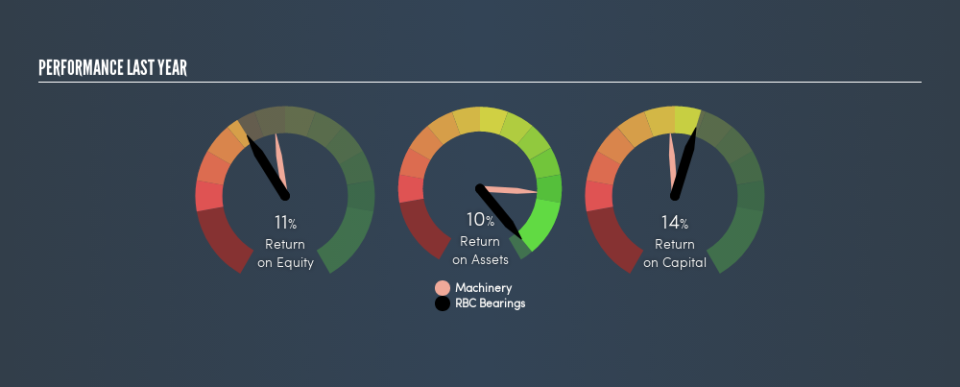
0.14 = US$149m ÷ (US$1.1b - US$90m) (Based on the trailing twelve months to March 2019.)
So, RBC Bearings has an ROCE of 14%.
View our latest analysis for RBC Bearings
Does RBC Bearings Have A Good ROCE?
ROCE can be useful when making comparisons, such as between similar companies. RBC Bearings's ROCE appears to be substantially greater than the 11% average in the Machinery industry. I think that's good to see, since it implies the company is better than other companies at making the most of its capital. Regardless of where RBC Bearings sits next to its industry, its ROCE in absolute terms appears satisfactory, and this company could be worth a closer look.
The image below shows how RBC Bearings's ROCE compares to its industry, and you can click it to see more detail on its past growth.
When considering this metric, keep in mind that it is backwards looking, and not necessarily predictive. Companies in cyclical industries can be difficult to understand using ROCE, as returns typically look high during boom times, and low during busts. ROCE is, after all, simply a snap shot of a single year. Future performance is what matters, and you can see analyst predictions in our free report on analyst forecasts for the company.
What Are Current Liabilities, And How Do They Affect RBC Bearings's ROCE?
Current liabilities are short term bills and invoices that need to be paid in 12 months or less. Due to the way the ROCE equation works, having large bills due in the near term can make it look as though a company has less capital employed, and thus a higher ROCE than usual. To check the impact of this, we calculate if a company has high current liabilities relative to its total assets.
RBC Bearings has total liabilities of US$90m and total assets of US$1.1b. As a result, its current liabilities are equal to approximately 7.9% of its total assets. Low current liabilities have only a minimal impact on RBC Bearings's ROCE, making its decent returns more credible.
The Bottom Line On RBC Bearings's ROCE
If RBC Bearings can continue reinvesting in its business, it could be an attractive prospect. RBC Bearings looks strong on this analysis, but there are plenty of other companies that could be a good opportunity . Here is a free list of companies growing earnings rapidly.
For those who like to find winning investments this free list of growing companies with recent insider purchasing, could be just the ticket.
We aim to bring you long-term focused research analysis driven by fundamental data. Note that our analysis may not factor in the latest price-sensitive company announcements or qualitative material.
If you spot an error that warrants correction, please contact the editor at editorial-team@simplywallst.com. This article by Simply Wall St is general in nature. It does not constitute a recommendation to buy or sell any stock, and does not take account of your objectives, or your financial situation. Simply Wall St has no position in the stocks mentioned. Thank you for reading.
