
 Yahoo Finance
 R. STAHL's (ETR:RSL2) Returns On Capital Are Heading Higher
There are a few key trends to look for if we want to identify the next multi-bagger. One common approach is to try and find a company with returns on capital employed (ROCE) that are increasing, in conjunction with a growing amount of capital employed. Basically this means that a company has profitable initiatives that it can continue to reinvest in, which is a trait of a compounding machine. So on that note, R. STAHL (ETR:RSL2) looks quite promising in regards to its trends of return on capital.
What Is Return On Capital Employed (ROCE)?
For those that aren't sure what ROCE is, it measures the amount of pre-tax profits a company can generate from the capital employed in its business. The formula for this calculation on R. STAHL is:
Return on Capital Employed = Earnings Before Interest and Tax (EBIT) ÷ (Total Assets - Current Liabilities)
0.11 = €17m ÷ (€280m - €118m) (Based on the trailing twelve months to March 2024).
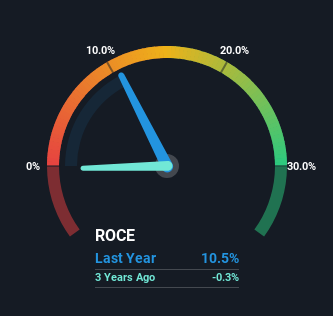
Thus, R. STAHL has an ROCE of 11%. That's a pretty standard return and it's in line with the industry average of 11%.
View our latest analysis for R. STAHL
In the above chart we have measured R. STAHL's prior ROCE against its prior performance, but the future is arguably more important. If you'd like, you can check out the forecasts from the analysts covering R. STAHL for free.
What The Trend Of ROCE Can Tell Us
Like most people, we're pleased that R. STAHL is now generating some pretax earnings. While the business is profitable now, it used to be incurring losses on invested capital five years ago. In regards to capital employed, R. STAHL is using 22% less capital than it was five years ago, which on the surface, can indicate that the business has become more efficient at generating these returns. The reduction could indicate that the company is selling some assets, and considering returns are up, they appear to be selling the right ones.
On a side note, we noticed that the improvement in ROCE appears to be partly fueled by an increase in current liabilities. The current liabilities has increased to 42% of total assets, so the business is now more funded by the likes of its suppliers or short-term creditors. Given it's pretty high ratio, we'd remind investors that having current liabilities at those levels can bring about some risks in certain businesses.
The Bottom Line On R. STAHL's ROCE
From what we've seen above, R. STAHL has managed to increase it's returns on capital all the while reducing it's capital base. Given the stock has declined 20% in the last five years, this could be a good investment if the valuation and other metrics are also appealing. With that in mind, we believe the promising trends warrant this stock for further investigation.
On a separate note, we've found 1 warning sign for R. STAHL you'll probably want to know about.
For those who like to invest in solid companies, check out this free list of companies with solid balance sheets and high returns on equity.
Have feedback on this article? Concerned about the content? Get in touch with us directly. Alternatively, email editorial-team (at) simplywallst.com.
This article by Simply Wall St is general in nature. We provide commentary based on historical data and analyst forecasts only using an unbiased methodology and our articles are not intended to be financial advice. It does not constitute a recommendation to buy or sell any stock, and does not take account of your objectives, or your financial situation. We aim to bring you long-term focused analysis driven by fundamental data. Note that our analysis may not factor in the latest price-sensitive company announcements or qualitative material. Simply Wall St has no position in any stocks mentioned.
