
 Yahoo Finance
 Is Qantas Airways Limited (ASX:QAN) A Financially Sound Company?

Small-caps and large-caps are wildly popular among investors, however, mid-cap stocks, such as Qantas Airways Limited (ASX:QAN), with a market capitalization of AU$8.8b, rarely draw their attention from the investing community. Despite this, commonly overlooked mid-caps have historically produced better risk-adjusted returns than their small and large-cap counterparts. Let’s take a look at QAN’s debt concentration and assess their financial liquidity to get an idea of their ability to fund strategic acquisitions and grow through cyclical pressures. Don’t forget that this is a general and concentrated examination of Qantas Airways’s financial health, so you should conduct further analysis into QAN here.
View our latest analysis for Qantas Airways
Want to help shape the future of investing tools and platforms? Take the survey and be part of one of the most advanced studies of stock market investors to date.
Does QAN produce enough cash relative to debt?
Over the past year, QAN has maintained its debt levels at around AU$4.7b including long-term debt. At this current level of debt, QAN’s cash and short-term investments stands at AU$1.7b , ready to deploy into the business. On top of this, QAN has generated cash from operations of AU$3.4b in the last twelve months, resulting in an operating cash to total debt ratio of 72%, meaning that QAN’s operating cash is sufficient to cover its debt. This ratio can also be a sign of operational efficiency as an alternative to return on assets. In QAN’s case, it is able to generate 0.72x cash from its debt capital.
Can QAN pay its short-term liabilities?
At the current liabilities level of AU$7.6b, the company arguably has a rather low level of current assets relative its obligations, with the current ratio last standing at 0.49x.
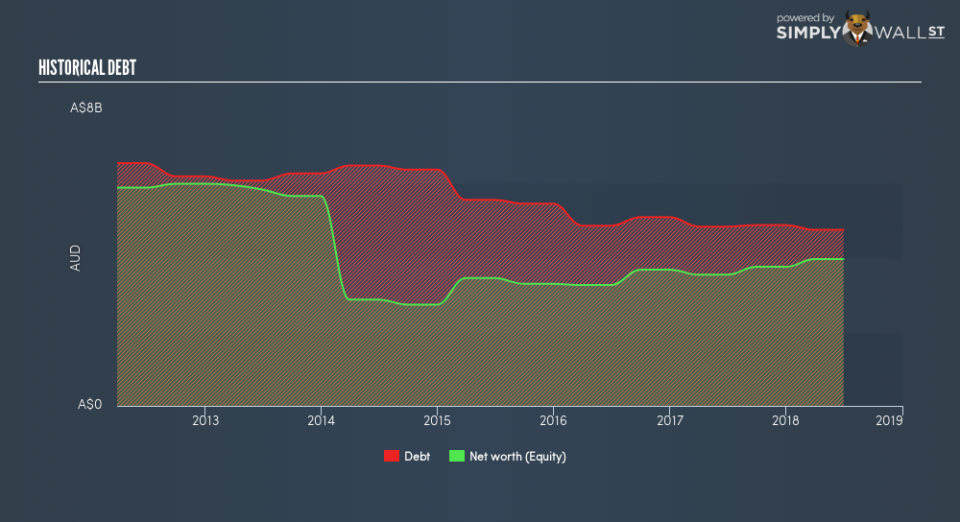
Is QAN’s debt level acceptable?
Since total debt levels have outpaced equities, QAN is a highly leveraged company. This is not uncommon for a mid-cap company given that debt tends to be lower-cost and at times, more accessible. No matter how high the company’s debt, if it can easily cover the interest payments, it’s considered to be efficient with its use of excess leverage. A company generating earnings after interest and tax at least three times its net interest payments is considered financially sound. In QAN’s case, the ratio of 10.41x suggests that interest is comfortably covered, which means that lenders may be inclined to lend more money to the company, as it is seen as safe in terms of payback.
Next Steps:
Although QAN’s debt level is towards the higher end of the spectrum, its cash flow coverage seems adequate to meet debt obligations which means its debt is being efficiently utilised. However, its low liquidity raises concerns over whether current asset management practices are properly implemented for the mid-cap. Keep in mind I haven’t considered other factors such as how QAN has been performing in the past. You should continue to research Qantas Airways to get a more holistic view of the stock by looking at:
Future Outlook: What are well-informed industry analysts predicting for QAN’s future growth? Take a look at our free research report of analyst consensus for QAN’s outlook.
Valuation: What is QAN worth today? Is the stock undervalued, even when its growth outlook is factored into its intrinsic value? The intrinsic value infographic in our free research report helps visualize whether QAN is currently mispriced by the market.
Other High-Performing Stocks: Are there other stocks that provide better prospects with proven track records? Explore our free list of these great stocks here.
To help readers see past the short term volatility of the financial market, we aim to bring you a long-term focused research analysis purely driven by fundamental data. Note that our analysis does not factor in the latest price-sensitive company announcements.
The author is an independent contributor and at the time of publication had no position in the stocks mentioned. For errors that warrant correction please contact the editor at editorial-team@simplywallst.com.
