
 Yahoo Finance
 Qantas Airways Limited (ASX:QAN) Earns Among The Best Returns In Its Industry

Today we'll look at Qantas Airways Limited (ASX:QAN) and reflect on its potential as an investment. To be precise, we'll consider its Return On Capital Employed (ROCE), as that will inform our view of the quality of the business.
First up, we'll look at what ROCE is and how we calculate it. Second, we'll look at its ROCE compared to similar companies. Then we'll determine how its current liabilities are affecting its ROCE.
Return On Capital Employed (ROCE): What is it?
ROCE is a measure of a company's yearly pre-tax profit (its return), relative to the capital employed in the business. All else being equal, a better business will have a higher ROCE. Overall, it is a valuable metric that has its flaws. Author Edwin Whiting says to be careful when comparing the ROCE of different businesses, since 'No two businesses are exactly alike.'
So, How Do We Calculate ROCE?
Analysts use this formula to calculate return on capital employed:
Return on Capital Employed = Earnings Before Interest and Tax (EBIT) ÷ (Total Assets - Current Liabilities)
Or for Qantas Airways:
0.13 = AU$1.4b ÷ (AU$19b - AU$7.9b) (Based on the trailing twelve months to December 2018.)
So, Qantas Airways has an ROCE of 13%.
Check out our latest analysis for Qantas Airways
Does Qantas Airways Have A Good ROCE?
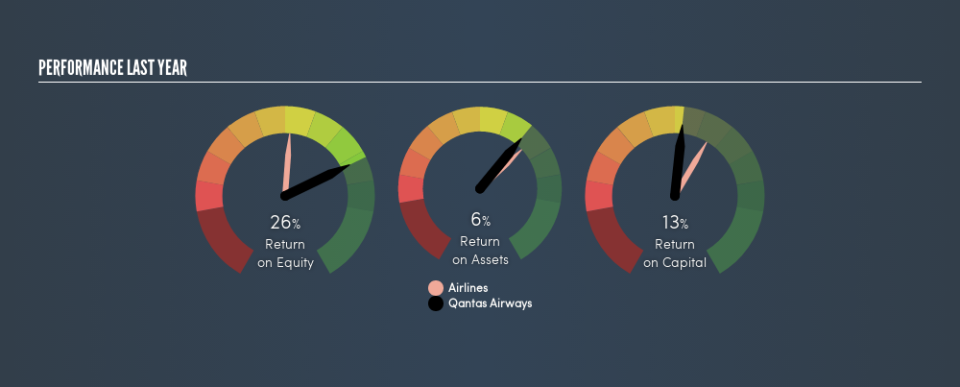
One way to assess ROCE is to compare similar companies. Qantas Airways's ROCE appears to be substantially greater than the 10% average in the Airlines industry. We consider this a positive sign, because it suggests it uses capital more efficiently than similar companies. Regardless of where Qantas Airways sits next to its industry, its ROCE in absolute terms appears satisfactory, and this company could be worth a closer look.
The image below shows how Qantas Airways's ROCE compares to its industry, and you can click it to see more detail on its past growth.
When considering this metric, keep in mind that it is backwards looking, and not necessarily predictive. Companies in cyclical industries can be difficult to understand using ROCE, as returns typically look high during boom times, and low during busts. ROCE is only a point-in-time measure. What happens in the future is pretty important for investors, so we have prepared a free report on analyst forecasts for Qantas Airways.
Do Qantas Airways's Current Liabilities Skew Its ROCE?
Short term (or current) liabilities, are things like supplier invoices, overdrafts, or tax bills that need to be paid within 12 months. Due to the way ROCE is calculated, a high level of current liabilities makes a company look as though it has less capital employed, and thus can (sometimes unfairly) boost the ROCE. To counteract this, we check if a company has high current liabilities, relative to its total assets.
Qantas Airways has total assets of AU$19b and current liabilities of AU$7.9b. As a result, its current liabilities are equal to approximately 42% of its total assets. With this level of current liabilities, Qantas Airways's ROCE is boosted somewhat.
Our Take On Qantas Airways's ROCE
While its ROCE looks good, it's worth remembering that the current liabilities are making the business look better. Qantas Airways looks strong on this analysis, but there are plenty of other companies that could be a good opportunity . Here is a free list of companies growing earnings rapidly.
For those who like to find winning investments this free list of growing companies with recent insider purchasing, could be just the ticket.
We aim to bring you long-term focused research analysis driven by fundamental data. Note that our analysis may not factor in the latest price-sensitive company announcements or qualitative material.
If you spot an error that warrants correction, please contact the editor at editorial-team@simplywallst.com. This article by Simply Wall St is general in nature. It does not constitute a recommendation to buy or sell any stock, and does not take account of your objectives, or your financial situation. Simply Wall St has no position in the stocks mentioned. Thank you for reading.
