
 Yahoo Finance
 What Is Prudential's (LON:PRU) P/E Ratio After Its Share Price Tanked?

Unfortunately for some shareholders, the Prudential (LON:PRU) share price has dived 49% in the last thirty days. Indeed the recent decline has arguably caused some bitterness for shareholders who have held through the 53% drop over twelve months.
Assuming nothing else has changed, a lower share price makes a stock more attractive to potential buyers. While the market sentiment towards a stock is very changeable, in the long run, the share price will tend to move in the same direction as earnings per share. The implication here is that long term investors have an opportunity when expectations of a company are too low. One way to gauge market expectations of a stock is to look at its Price to Earnings Ratio (PE Ratio). A high P/E ratio means that investors have a high expectation about future growth, while a low P/E ratio means they have low expectations about future growth.
Check out our latest analysis for Prudential
Does Prudential Have A Relatively High Or Low P/E For Its Industry?
Prudential's P/E of 11.73 indicates some degree of optimism towards the stock. The image below shows that Prudential has a higher P/E than the average (10.8) P/E for companies in the insurance industry.
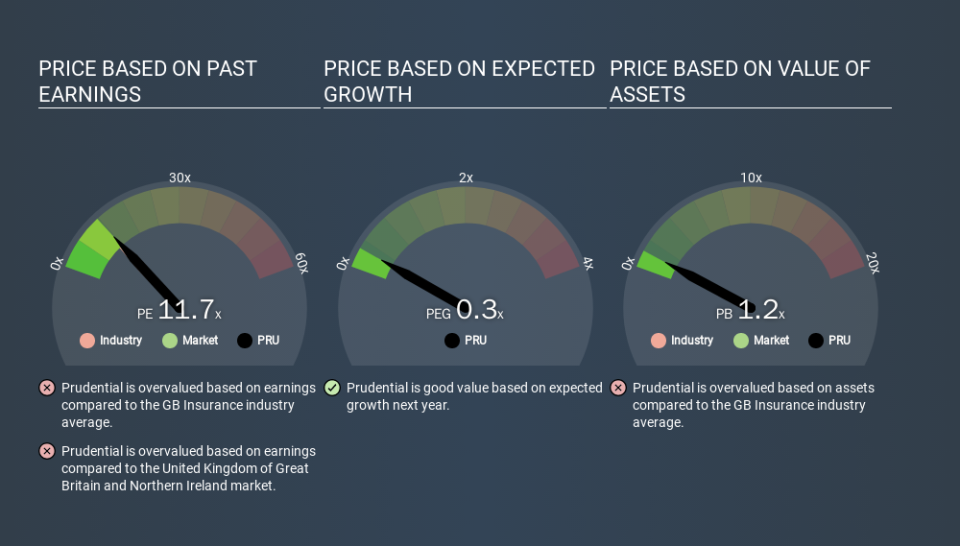
Prudential's P/E tells us that market participants think the company will perform better than its industry peers, going forward. Clearly the market expects growth, but it isn't guaranteed. So investors should always consider the P/E ratio alongside other factors, such as whether company directors have been buying shares.
How Growth Rates Impact P/E Ratios
Companies that shrink earnings per share quickly will rapidly decrease the 'E' in the equation. That means even if the current P/E is low, it will increase over time if the share price stays flat. So while a stock may look cheap based on past earnings, it could be expensive based on future earnings.
Prudential's earnings per share fell by 33% in the last twelve months. And EPS is down 11% a year, over the last 5 years. This growth rate might warrant a below average P/E ratio.
Remember: P/E Ratios Don't Consider The Balance Sheet
The 'Price' in P/E reflects the market capitalization of the company. So it won't reflect the advantage of cash, or disadvantage of debt. Hypothetically, a company could reduce its future P/E ratio by spending its cash (or taking on debt) to achieve higher earnings.
While growth expenditure doesn't always pay off, the point is that it is a good option to have; but one that the P/E ratio ignores.
How Does Prudential's Debt Impact Its P/E Ratio?
Prudential has net debt equal to 35% of its market cap. While it's worth keeping this in mind, it isn't a worry.
The Verdict On Prudential's P/E Ratio
Prudential has a P/E of 11.7. That's around the same as the average in the GB market, which is 11.2. Given it has some debt, but didn't grow last year, the P/E indicates the market is expecting higher profits ahead for the business. What can be absolutely certain is that the market has become significantly less optimistic about Prudential over the last month, with the P/E ratio falling from 22.9 back then to 11.7 today. For those who don't like to trade against momentum, that could be a warning sign, but a contrarian investor might want to take a closer look.
When the market is wrong about a stock, it gives savvy investors an opportunity. People often underestimate remarkable growth -- so investors can make money when fast growth is not fully appreciated. So this free visual report on analyst forecasts could hold the key to an excellent investment decision.
Of course, you might find a fantastic investment by looking at a few good candidates. So take a peek at this free list of companies with modest (or no) debt, trading on a P/E below 20.
If you spot an error that warrants correction, please contact the editor at editorial-team@simplywallst.com. This article by Simply Wall St is general in nature. It does not constitute a recommendation to buy or sell any stock, and does not take account of your objectives, or your financial situation. Simply Wall St has no position in the stocks mentioned.
We aim to bring you long-term focused research analysis driven by fundamental data. Note that our analysis may not factor in the latest price-sensitive company announcements or qualitative material. Thank you for reading.
