
 Yahoo Finance
 Price & Time: FX Volatility - How Low Can It Go?
Talking Points
Narrowest weekly range on record last week in the Euro
USD/JPY rebound continues
Gold nearing key downside pivot
New to Currency Trading? Learn More HERE
Foreign Exchange Price & Time at a Glance:
Price & Time Analysis: USD/JPY

Charts Created using Marketscope – Prepared by Kristian Kerr
USD/JPY has moved steadily higher since rebounding off the 4th square root relationship of the year’s high at 101.35 earlier in the month
Our near-term trend bias is lower in the exchange rate while below 103.10
Interim support is seen at 102.35, but a move under 101.35 is really needed to kick start any sort of meaningful move to the downside
A very minor cycle turn window is seen on Wednesday
A daily close over 103.10 would shift our near-term trend bias to positive
USD/JPY Strategy: Short against 103.10.
Instrument | Support 2 | Support 1 | Spot | Resistance 1 | Resistance 2 |
USD/JPY | *101.35 | 102.35 | 102.55 | *103.10 | 103.40 |
Price & Time Analysis: GOLD

Charts Created using Marketscope – Prepared by Kristian Kerr
XAU/USD has been under steady pressure since failing mid-month just shy of the 50% retracement of the March to April decline
Our near-term trend bias is lower in Gold while 1331 remains intact
The 1276 level is an important downside pivot with weakness below needed to signal a new leg lower in the metal
The middle of next week is the next material turn window
Strength over 1331 would turn us positive on Gold
XAU/USD Strategy: Like the short side while under 1331.
Instrument | Support 2 | Support 1 | Spot | Resistance 1 | Resistance 2 |
XAU/USD | 1246 | *1276 | 1291 | 1305 | *1331 |
Focus Chart of the Day: EUR/USD
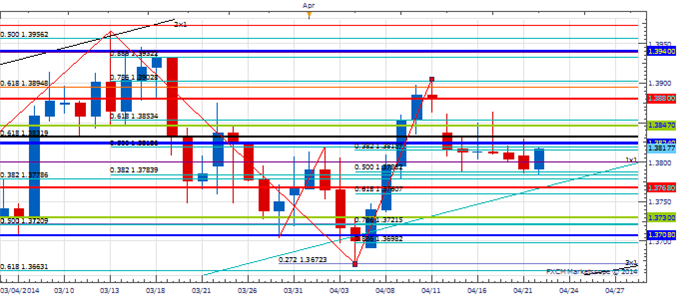
To say volatility in the G10 FX space is low at the moment is a bit of an understatement. 1-month implied vol in EUR/USD now routinely trades on a 5 handle. Last week the trading range in the Euro was only about 75 pips (0.5%). This was the narrowest weekly trading range in the exchange rate since the inception of the single currency. On the surface central banks have seemingly succeeded in their quixotic quest to suppress volatility. This has spawned a raging bull market in complacency. Market history and the long-term mean reverting nature of volatility suggest such a high level of complacency cannot go on for very much longer, but the 25,000 Euro question is when will vol start to pick up meaningfully? Our best guess is the second half of this year. Volatility like just about everything else in the markets seems to have a strong cyclical component. With a convergence of several key long-term timing relationships eyed over the 3rd and 4th quarters of 2014 some sort of Minsky type moment looks destined to play out later this year as the markets remind us that nobody is omnipotent – not even our beloved central banks.
To receive Kristian’s analysis directly via email, please SIGN UP HERE.
--- Written by Kristian Kerr, Senior Currency Strategist for DailyFX.com
This publication attempts to further explore the concept that mass movements of human psychology, as represented by the financial markets, are subject to the mathematical laws of nature and through the use of various geometric, arithmetic, statistical and cyclical techniques a better understanding of markets and their corresponding movements can be achieved.
To contact Kristian, e-mail kkerr@fxcm.com. Follow me on Twitter @KKerrFX
DailyFX provides forex news and technical analysis on the trends that influence the global currency markets.
Learn forex trading with a free practice account and trading charts from FXCM.
