
 Yahoo Finance
 Positive earnings growth hasn't been enough to get XP (NASDAQ:XP) shareholders a favorable return over the last year
Investors can approximate the average market return by buying an index fund. While individual stocks can be big winners, plenty more fail to generate satisfactory returns. Unfortunately the XP Inc. (NASDAQ:XP) share price slid 46% over twelve months. That's disappointing when you consider the market declined 25%. XP may have better days ahead, of course; we've only looked at a one year period. The falls have accelerated recently, with the share price down 23% in the last three months. However, one could argue that the price has been influenced by the general market, which is down 10% in the same timeframe.
While the last year has been tough for XP shareholders, this past week has shown signs of promise. So let's look at the longer term fundamentals and see if they've been the driver of the negative returns.
View our latest analysis for XP
There is no denying that markets are sometimes efficient, but prices do not always reflect underlying business performance. One imperfect but simple way to consider how the market perception of a company has shifted is to compare the change in the earnings per share (EPS) with the share price movement.
Even though the XP share price is down over the year, its EPS actually improved. Of course, the situation might betray previous over-optimism about growth.
It's surprising to see the share price fall so much, despite the improved EPS. So it's easy to justify a look at some other metrics.
XP managed to grow revenue over the last year, which is usually a real positive. Since we can't easily explain the share price movement based on these metrics, it might be worth considering how market sentiment has changed towards the stock.
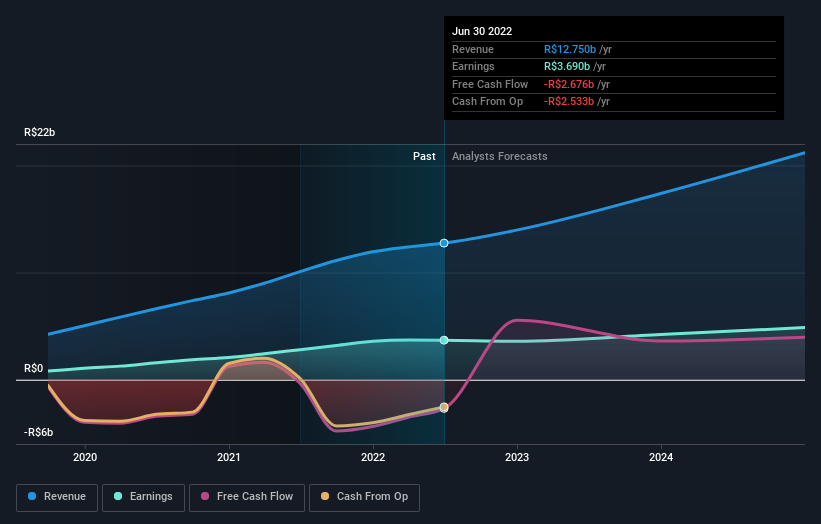
The image below shows how earnings and revenue have tracked over time (if you click on the image you can see greater detail).
XP is well known by investors, and plenty of clever analysts have tried to predict the future profit levels. If you are thinking of buying or selling XP stock, you should check out this free report showing analyst consensus estimates for future profits.
A Different Perspective
XP shareholders are down 46% for the year, even worse than the market loss of 25%. There's no doubt that's a disappointment, but the stock may well have fared better in a stronger market. With the stock down 23% over the last three months, the market doesn't seem to believe that the company has solved all its problems. Basically, most investors should be wary of buying into a poor-performing stock, unless the business itself has clearly improved. If you would like to research XP in more detail then you might want to take a look at whether insiders have been buying or selling shares in the company.
If you would prefer to check out another company -- one with potentially superior financials -- then do not miss this free list of companies that have proven they can grow earnings.
Please note, the market returns quoted in this article reflect the market weighted average returns of stocks that currently trade on US exchanges.
Have feedback on this article? Concerned about the content? Get in touch with us directly. Alternatively, email editorial-team (at) simplywallst.com.
This article by Simply Wall St is general in nature. We provide commentary based on historical data and analyst forecasts only using an unbiased methodology and our articles are not intended to be financial advice. It does not constitute a recommendation to buy or sell any stock, and does not take account of your objectives, or your financial situation. We aim to bring you long-term focused analysis driven by fundamental data. Note that our analysis may not factor in the latest price-sensitive company announcements or qualitative material. Simply Wall St has no position in any stocks mentioned.
Join A Paid User Research Session
You’ll receive a US$30 Amazon Gift card for 1 hour of your time while helping us build better investing tools for the individual investors like yourself. Sign up here
