
 Yahoo Finance
 Are Poor Financial Prospects Dragging Down Mayfield Childcare Limited (ASX:MFD Stock?
Mayfield Childcare (ASX:MFD) has had a rough week with its share price down 1.9%. Given that stock prices are usually driven by a company’s fundamentals over the long term, which in this case look pretty weak, we decided to study the company's key financial indicators. In this article, we decided to focus on Mayfield Childcare's ROE.
Return on equity or ROE is a key measure used to assess how efficiently a company's management is utilizing the company's capital. Simply put, it is used to assess the profitability of a company in relation to its equity capital.
See our latest analysis for Mayfield Childcare
How Is ROE Calculated?
The formula for ROE is:
Return on Equity = Net Profit (from continuing operations) ÷ Shareholders' Equity
So, based on the above formula, the ROE for Mayfield Childcare is:
7.0% = AU$4.9m ÷ AU$70m (Based on the trailing twelve months to December 2022).
The 'return' is the profit over the last twelve months. Another way to think of that is that for every A$1 worth of equity, the company was able to earn A$0.07 in profit.
Why Is ROE Important For Earnings Growth?
We have already established that ROE serves as an efficient profit-generating gauge for a company's future earnings. Depending on how much of these profits the company reinvests or "retains", and how effectively it does so, we are then able to assess a company’s earnings growth potential. Assuming everything else remains unchanged, the higher the ROE and profit retention, the higher the growth rate of a company compared to companies that don't necessarily bear these characteristics.
Mayfield Childcare's Earnings Growth And 7.0% ROE
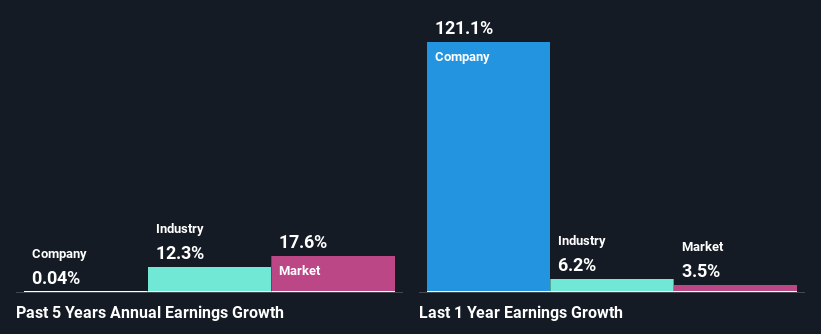
When you first look at it, Mayfield Childcare's ROE doesn't look that attractive. Yet, a closer study shows that the company's ROE is similar to the industry average of 7.3%. Still, Mayfield Childcare has seen a flat net income growth over the past five years. Bear in mind, the company's ROE is not very high. So that could also be one of the reasons behind the company's flat growth in earnings.
As a next step, we compared Mayfield Childcare's net income growth with the industry and were disappointed to see that the company's growth is lower than the industry average growth of 12% in the same period.
The basis for attaching value to a company is, to a great extent, tied to its earnings growth. It’s important for an investor to know whether the market has priced in the company's expected earnings growth (or decline). Doing so will help them establish if the stock's future looks promising or ominous. Is Mayfield Childcare fairly valued compared to other companies? These 3 valuation measures might help you decide.
Is Mayfield Childcare Using Its Retained Earnings Effectively?
Mayfield Childcare has a high three-year median payout ratio of 69% (or a retention ratio of 31%), meaning that the company is paying most of its profits as dividends to its shareholders. This does go some way in explaining why there's been no growth in its earnings.
Additionally, Mayfield Childcare has paid dividends over a period of five years, which means that the company's management is determined to pay dividends even if it means little to no earnings growth.
Summary
Overall, we would be extremely cautious before making any decision on Mayfield Childcare. As a result of its low ROE and lack of much reinvestment into the business, the company has seen a disappointing earnings growth rate. Up till now, we've only made a short study of the company's growth data. So it may be worth checking this free detailed graph of Mayfield Childcare's past earnings, as well as revenue and cash flows to get a deeper insight into the company's performance.
Have feedback on this article? Concerned about the content? Get in touch with us directly. Alternatively, email editorial-team (at) simplywallst.com.
This article by Simply Wall St is general in nature. We provide commentary based on historical data and analyst forecasts only using an unbiased methodology and our articles are not intended to be financial advice. It does not constitute a recommendation to buy or sell any stock, and does not take account of your objectives, or your financial situation. We aim to bring you long-term focused analysis driven by fundamental data. Note that our analysis may not factor in the latest price-sensitive company announcements or qualitative material. Simply Wall St has no position in any stocks mentioned.
Join A Paid User Research Session
You’ll receive a US$30 Amazon Gift card for 1 hour of your time while helping us build better investing tools for the individual investors like yourself. Sign up here
