
 Yahoo Finance
 Pinning Down Vertex Pharmaceuticals Incorporated's (NASDAQ:VRTX) P/E Is Difficult Right Now
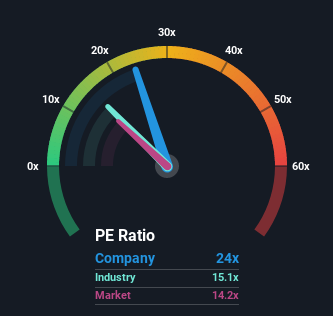
Vertex Pharmaceuticals Incorporated's (NASDAQ:VRTX) price-to-earnings (or "P/E") ratio of 24x might make it look like a strong sell right now compared to the market in the United States, where around half of the companies have P/E ratios below 14x and even P/E's below 8x are quite common. Although, it's not wise to just take the P/E at face value as there may be an explanation why it's so lofty.
With earnings growth that's superior to most other companies of late, Vertex Pharmaceuticals has been doing relatively well. It seems that many are expecting the strong earnings performance to persist, which has raised the P/E. If not, then existing shareholders might be a little nervous about the viability of the share price.
Check out our latest analysis for Vertex Pharmaceuticals
Keen to find out how analysts think Vertex Pharmaceuticals' future stacks up against the industry? In that case, our free report is a great place to start.
Does Growth Match The High P/E?
In order to justify its P/E ratio, Vertex Pharmaceuticals would need to produce outstanding growth well in excess of the market.
Taking a look back first, we see that the company grew earnings per share by an impressive 63% last year. Pleasingly, EPS has also lifted 44% in aggregate from three years ago, thanks to the last 12 months of growth. Therefore, it's fair to say the earnings growth recently has been superb for the company.
Turning to the outlook, the next three years should generate growth of 7.8% each year as estimated by the analysts watching the company. With the market predicted to deliver 9.6% growth per annum, the company is positioned for a comparable earnings result.
With this information, we find it interesting that Vertex Pharmaceuticals is trading at a high P/E compared to the market. It seems most investors are ignoring the fairly average growth expectations and are willing to pay up for exposure to the stock. Although, additional gains will be difficult to achieve as this level of earnings growth is likely to weigh down the share price eventually.
The Key Takeaway
Generally, our preference is to limit the use of the price-to-earnings ratio to establishing what the market thinks about the overall health of a company.
We've established that Vertex Pharmaceuticals currently trades on a higher than expected P/E since its forecast growth is only in line with the wider market. When we see an average earnings outlook with market-like growth, we suspect the share price is at risk of declining, sending the high P/E lower. This places shareholders' investments at risk and potential investors in danger of paying an unnecessary premium.
It is also worth noting that we have found 1 warning sign for Vertex Pharmaceuticals that you need to take into consideration.
Of course, you might find a fantastic investment by looking at a few good candidates. So take a peek at this free list of companies with a strong growth track record, trading on a P/E below 20x.
Have feedback on this article? Concerned about the content? Get in touch with us directly. Alternatively, email editorial-team (at) simplywallst.com.
This article by Simply Wall St is general in nature. We provide commentary based on historical data and analyst forecasts only using an unbiased methodology and our articles are not intended to be financial advice. It does not constitute a recommendation to buy or sell any stock, and does not take account of your objectives, or your financial situation. We aim to bring you long-term focused analysis driven by fundamental data. Note that our analysis may not factor in the latest price-sensitive company announcements or qualitative material. Simply Wall St has no position in any stocks mentioned.
Join A Paid User Research Session
You’ll receive a US$30 Amazon Gift card for 1 hour of your time while helping us build better investing tools for the individual investors like yourself. Sign up here
