
 Yahoo Finance
 Is Perceptron, Inc.’s (NASDAQ:PRCP) Capital Allocation Ability Worth Your Time?

Today we’ll look at Perceptron, Inc. (NASDAQ:PRCP) and reflect on its potential as an investment. To be precise, we’ll consider its Return On Capital Employed (ROCE), as that will inform our view of the quality of the business.
Firstly, we’ll go over how we calculate ROCE. Second, we’ll look at its ROCE compared to similar companies. And finally, we’ll look at how its current liabilities are impacting its ROCE.
What is Return On Capital Employed (ROCE)?
ROCE measures the ‘return’ (pre-tax profit) a company generates from capital employed in its business. Generally speaking a higher ROCE is better. In brief, it is a useful tool, but it is not without drawbacks. Renowned investment researcher Michael Mauboussin has suggested that a high ROCE can indicate that ‘one dollar invested in the company generates value of more than one dollar’.
How Do You Calculate Return On Capital Employed?
The formula for calculating the return on capital employed is:
Return on Capital Employed = Earnings Before Interest and Tax (EBIT) ÷ (Total Assets – Current Liabilities)
Or for Perceptron:
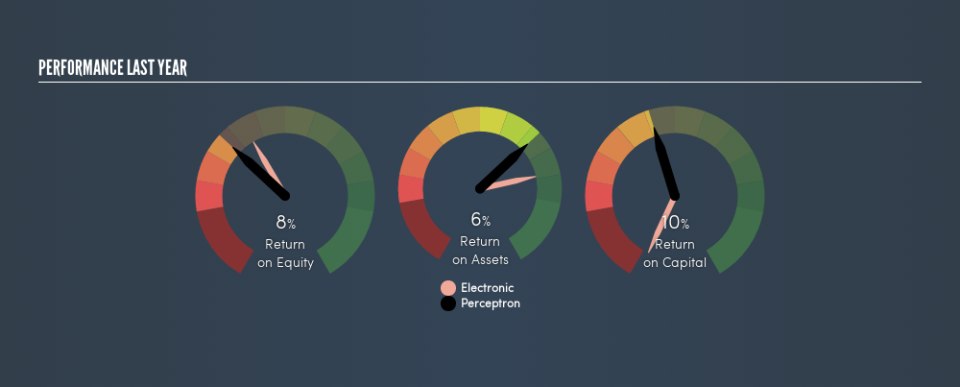
0.10 = US$5.6m ÷ (US$75m – US$22m) (Based on the trailing twelve months to December 2018.)
Therefore, Perceptron has an ROCE of 10.0%.
Check out our latest analysis for Perceptron
Is Perceptron’s ROCE Good?
One way to assess ROCE is to compare similar companies. We can see Perceptron’s ROCE is around the 11% average reported by the Electronic industry. Aside from the industry comparison, Perceptron’s ROCE is mediocre in absolute terms, considering the risk of investing in stocks versus the safety of a bank account. Investors may wish to consider higher-performing investments.
Perceptron has an ROCE of 10.0%, but it didn’t have an ROCE 3 years ago, since it was unprofitable. That suggests the business has returned to profitability.
Remember that this metric is backwards looking – it shows what has happened in the past, and does not accurately predict the future. ROCE can be misleading for companies in cyclical industries, with returns looking impressive during the boom times, but very weak during the busts. ROCE is, after all, simply a snap shot of a single year. Future performance is what matters, and you can see analyst predictions in our free report on analyst forecasts for the company.
Do Perceptron’s Current Liabilities Skew Its ROCE?
Short term (or current) liabilities, are things like supplier invoices, overdrafts, or tax bills that need to be paid within 12 months. Due to the way the ROCE equation works, having large bills due in the near term can make it look as though a company has less capital employed, and thus a higher ROCE than usual. To check the impact of this, we calculate if a company has high current liabilities relative to its total assets.
Perceptron has total assets of US$75m and current liabilities of US$22m. Therefore its current liabilities are equivalent to approximately 30% of its total assets. This very reasonable level of current liabilities would not boost the ROCE by much.
What We Can Learn From Perceptron’s ROCE
If Perceptron continues to earn an uninspiring ROCE, there may be better places to invest. Of course you might be able to find a better stock than Perceptron. So you may wish to see this free collection of other companies that have grown earnings strongly.
For those who like to find winning investments this free list of growing companies with recent insider purchasing, could be just the ticket.
We aim to bring you long-term focused research analysis driven by fundamental data. Note that our analysis may not factor in the latest price-sensitive company announcements or qualitative material.
If you spot an error that warrants correction, please contact the editor at editorial-team@simplywallst.com. This article by Simply Wall St is general in nature. It does not constitute a recommendation to buy or sell any stock, and does not take account of your objectives, or your financial situation. Simply Wall St has no position in the stocks mentioned. Thank you for reading.
