
 Yahoo Finance
 The past three years for Retech Technology (ASX:RTE) investors has not been profitable
While not a mind-blowing move, it is good to see that the Retech Technology Co., Limited (ASX:RTE) share price has gained 16% in the last three months. But that doesn't change the fact that the returns over the last three years have been less than pleasing. In fact, the share price is down 28% in the last three years, falling well short of the market return.
Since shareholders are down over the longer term, lets look at the underlying fundamentals over the that time and see if they've been consistent with returns.
Check out our latest analysis for Retech Technology
In his essay The Superinvestors of Graham-and-Doddsville Warren Buffett described how share prices do not always rationally reflect the value of a business. One way to examine how market sentiment has changed over time is to look at the interaction between a company's share price and its earnings per share (EPS).
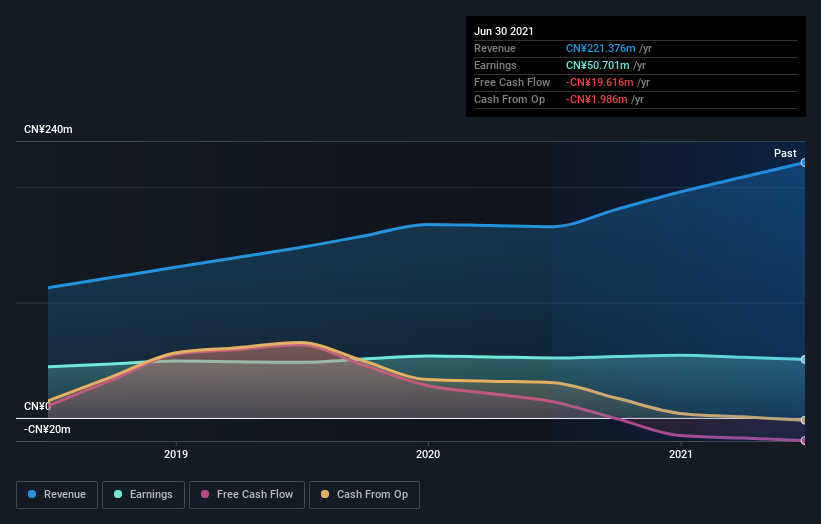
During the unfortunate three years of share price decline, Retech Technology actually saw its earnings per share (EPS) improve by 3.4% per year. Given the share price reaction, one might suspect that EPS is not a good guide to the business performance during the period (perhaps due to a one-off loss or gain). Alternatively, growth expectations may have been unreasonable in the past.
It looks to us like the market was probably too optimistic around growth three years ago. However, taking a look at other business metrics might shed a bit more light on the share price action.
Revenue is actually up 20% over the three years, so the share price drop doesn't seem to hinge on revenue, either. This analysis is just perfunctory, but it might be worth researching Retech Technology more closely, as sometimes stocks fall unfairly. This could present an opportunity.
You can see how earnings and revenue have changed over time in the image below (click on the chart to see the exact values).
Take a more thorough look at Retech Technology's financial health with this free report on its balance sheet.
A Different Perspective
Retech Technology shareholders are down 9.4% for the year, but the broader market is up 27%. Of course the long term matters more than the short term, and even great stocks will sometimes have a poor year. Unfortunately, the longer term story isn't pretty, with investment losses running at 8% per year over three years. We'd need clear signs of growth in the underlying business before we could muster much enthusiasm for this one. I find it very interesting to look at share price over the long term as a proxy for business performance. But to truly gain insight, we need to consider other information, too. For instance, we've identified 2 warning signs for Retech Technology (1 is significant) that you should be aware of.
For those who like to find winning investments this free list of growing companies with recent insider purchasing, could be just the ticket.
Please note, the market returns quoted in this article reflect the market weighted average returns of stocks that currently trade on AU exchanges.
This article by Simply Wall St is general in nature. We provide commentary based on historical data and analyst forecasts only using an unbiased methodology and our articles are not intended to be financial advice. It does not constitute a recommendation to buy or sell any stock, and does not take account of your objectives, or your financial situation. We aim to bring you long-term focused analysis driven by fundamental data. Note that our analysis may not factor in the latest price-sensitive company announcements or qualitative material. Simply Wall St has no position in any stocks mentioned.
Have feedback on this article? Concerned about the content? Get in touch with us directly. Alternatively, email editorial-team (at) simplywallst.com.
