
 Yahoo Finance
 The past three years for MedAdvisor (ASX:MDR) investors has not been profitable
If you love investing in stocks you're bound to buy some losers. But the last three years have been particularly tough on longer term MedAdvisor Limited (ASX:MDR) shareholders. Regrettably, they have had to cope with a 60% drop in the share price over that period. Even worse, it's down 19% in about a month, which isn't fun at all.
Since shareholders are down over the longer term, lets look at the underlying fundamentals over the that time and see if they've been consistent with returns.
Check out our latest analysis for MedAdvisor
Given that MedAdvisor didn't make a profit in the last twelve months, we'll focus on revenue growth to form a quick view of its business development. When a company doesn't make profits, we'd generally expect to see good revenue growth. Some companies are willing to postpone profitability to grow revenue faster, but in that case one does expect good top-line growth.
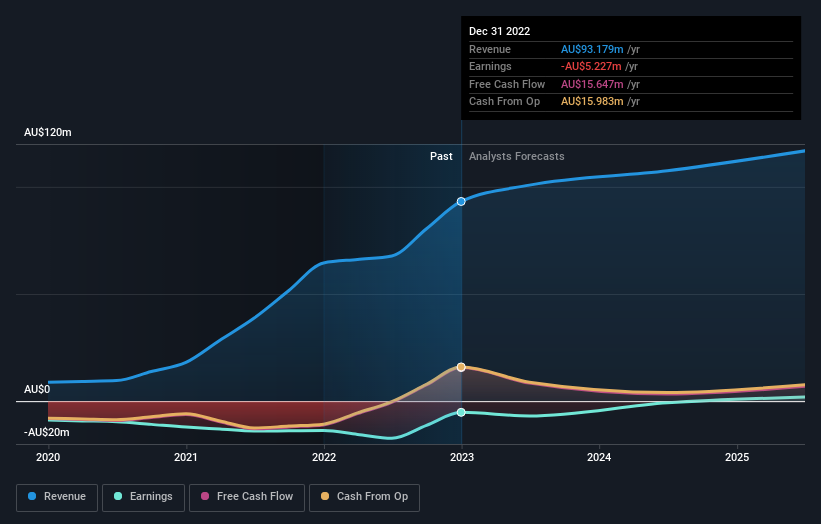
Over three years, MedAdvisor grew revenue at 71% per year. That's well above most other pre-profit companies. In contrast, the share price is down 17% compound, over three years - disappointing by most standards. It seems likely that the market is worried about the continual losses. When we see revenue growth, paired with a falling share price, we can't help wonder if there is an opportunity for those who are willing to dig deeper.
The company's revenue and earnings (over time) are depicted in the image below (click to see the exact numbers).
Balance sheet strength is crucial. It might be well worthwhile taking a look at our free report on how its financial position has changed over time.
A Different Perspective
MedAdvisor shareholders are down 2.3% for the year, but the market itself is up 3.2%. However, keep in mind that even the best stocks will sometimes underperform the market over a twelve month period. However, the loss over the last year isn't as bad as the 5% per annum loss investors have suffered over the last half decade. We'd need to see some sustained improvements in the key metrics before we could muster much enthusiasm. It's always interesting to track share price performance over the longer term. But to understand MedAdvisor better, we need to consider many other factors. Consider for instance, the ever-present spectre of investment risk. We've identified 2 warning signs with MedAdvisor , and understanding them should be part of your investment process.
If you would prefer to check out another company -- one with potentially superior financials -- then do not miss this free list of companies that have proven they can grow earnings.
Please note, the market returns quoted in this article reflect the market weighted average returns of stocks that currently trade on Australian exchanges.
Have feedback on this article? Concerned about the content? Get in touch with us directly. Alternatively, email editorial-team (at) simplywallst.com.
This article by Simply Wall St is general in nature. We provide commentary based on historical data and analyst forecasts only using an unbiased methodology and our articles are not intended to be financial advice. It does not constitute a recommendation to buy or sell any stock, and does not take account of your objectives, or your financial situation. We aim to bring you long-term focused analysis driven by fundamental data. Note that our analysis may not factor in the latest price-sensitive company announcements or qualitative material. Simply Wall St has no position in any stocks mentioned.
Join A Paid User Research Session
You’ll receive a US$30 Amazon Gift card for 1 hour of your time while helping us build better investing tools for the individual investors like yourself. Sign up here
