
 Yahoo Finance
 The past three years for Heron Therapeutics (NASDAQ:HRTX) investors has not been profitable
Heron Therapeutics, Inc. (NASDAQ:HRTX) shareholders should be happy to see the share price up 12% in the last month. But the last three years have seen a terrible decline. In that time the share price has melted like a snowball in the desert, down 87%. So we're relieved for long term holders to see a bit of uplift. The thing to think about is whether the business has really turned around. We really feel for shareholders in this scenario. It's a good reminder of the importance of diversification, and it's worth keeping in mind there's more to life than money, anyway.
It's worthwhile assessing if the company's economics have been moving in lockstep with these underwhelming shareholder returns, or if there is some disparity between the two. So let's do just that.
Check out our latest analysis for Heron Therapeutics
Given that Heron Therapeutics didn't make a profit in the last twelve months, we'll focus on revenue growth to form a quick view of its business development. Generally speaking, companies without profits are expected to grow revenue every year, and at a good clip. That's because fast revenue growth can be easily extrapolated to forecast profits, often of considerable size.
Over the last three years, Heron Therapeutics' revenue dropped 18% per year. That means its revenue trend is very weak compared to other loss making companies. The swift share price decline at an annual compound rate of 23%, reflects this weak fundamental performance. We prefer leave it to clowns to try to catch falling knives, like this stock. There is a good reason that investors often describe buying a sharply falling stock price as 'trying to catch a falling knife'. Think about it.
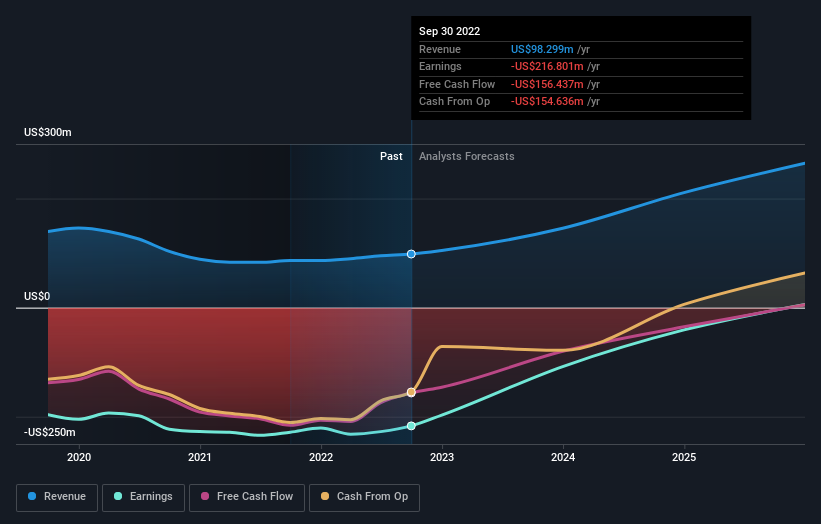
The company's revenue and earnings (over time) are depicted in the image below (click to see the exact numbers).
If you are thinking of buying or selling Heron Therapeutics stock, you should check out this FREE detailed report on its balance sheet.
A Different Perspective
We regret to report that Heron Therapeutics shareholders are down 68% for the year. Unfortunately, that's worse than the broader market decline of 7.7%. However, it could simply be that the share price has been impacted by broader market jitters. It might be worth keeping an eye on the fundamentals, in case there's a good opportunity. Regrettably, last year's performance caps off a bad run, with the shareholders facing a total loss of 13% per year over five years. Generally speaking long term share price weakness can be a bad sign, though contrarian investors might want to research the stock in hope of a turnaround. While it is well worth considering the different impacts that market conditions can have on the share price, there are other factors that are even more important. For instance, we've identified 4 warning signs for Heron Therapeutics that you should be aware of.
Of course Heron Therapeutics may not be the best stock to buy. So you may wish to see this free collection of growth stocks.
Please note, the market returns quoted in this article reflect the market weighted average returns of stocks that currently trade on US exchanges.
Have feedback on this article? Concerned about the content? Get in touch with us directly. Alternatively, email editorial-team (at) simplywallst.com.
This article by Simply Wall St is general in nature. We provide commentary based on historical data and analyst forecasts only using an unbiased methodology and our articles are not intended to be financial advice. It does not constitute a recommendation to buy or sell any stock, and does not take account of your objectives, or your financial situation. We aim to bring you long-term focused analysis driven by fundamental data. Note that our analysis may not factor in the latest price-sensitive company announcements or qualitative material. Simply Wall St has no position in any stocks mentioned.
Join A Paid User Research Session
You’ll receive a US$30 Amazon Gift card for 1 hour of your time while helping us build better investing tools for the individual investors like yourself. Sign up here
