
 Yahoo Finance
 The past year for Liberty Financial Group (ASX:LFG) investors has not been profitable
The simplest way to benefit from a rising market is to buy an index fund. While individual stocks can be big winners, plenty more fail to generate satisfactory returns. Unfortunately the Liberty Financial Group Limited (ASX:LFG) share price slid 12% over twelve months. That falls noticeably short of the market return of around 8.2%. We wouldn't rush to judgement on Liberty Financial Group because we don't have a long term history to look at.
It's worthwhile assessing if the company's economics have been moving in lockstep with these underwhelming shareholder returns, or if there is some disparity between the two. So let's do just that.
Check out our latest analysis for Liberty Financial Group
In his essay The Superinvestors of Graham-and-Doddsville Warren Buffett described how share prices do not always rationally reflect the value of a business. One imperfect but simple way to consider how the market perception of a company has shifted is to compare the change in the earnings per share (EPS) with the share price movement.
Unhappily, Liberty Financial Group had to report a 5.7% decline in EPS over the last year. This reduction in EPS is not as bad as the 12% share price fall. This suggests the EPS fall has made some shareholders are more nervous about the business. The less favorable sentiment is reflected in its current P/E ratio of 5.54.
You can see below how EPS has changed over time (discover the exact values by clicking on the image).
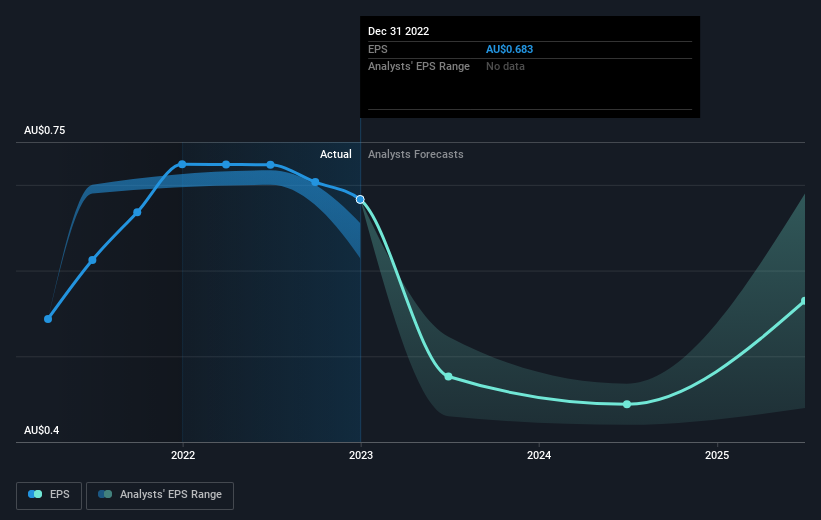
Dive deeper into Liberty Financial Group's key metrics by checking this interactive graph of Liberty Financial Group's earnings, revenue and cash flow.
What About Dividends?
When looking at investment returns, it is important to consider the difference between total shareholder return (TSR) and share price return. Whereas the share price return only reflects the change in the share price, the TSR includes the value of dividends (assuming they were reinvested) and the benefit of any discounted capital raising or spin-off. So for companies that pay a generous dividend, the TSR is often a lot higher than the share price return. In the case of Liberty Financial Group, it has a TSR of -1.6% for the last 1 year. That exceeds its share price return that we previously mentioned. And there's no prize for guessing that the dividend payments largely explain the divergence!
A Different Perspective
While Liberty Financial Group shareholders are down 1.6% for the year (even including dividends), the market itself is up 8.2%. However, keep in mind that even the best stocks will sometimes underperform the market over a twelve month period. Notably, the loss over the last year isn't as bad as the 3.1% drop in the last three months. This probably signals that the business has recently disappointed shareholders - it will take time to win them back. While it is well worth considering the different impacts that market conditions can have on the share price, there are other factors that are even more important. Even so, be aware that Liberty Financial Group is showing 2 warning signs in our investment analysis , and 1 of those is significant...
Of course, you might find a fantastic investment by looking elsewhere. So take a peek at this free list of companies we expect will grow earnings.
Please note, the market returns quoted in this article reflect the market weighted average returns of stocks that currently trade on Australian exchanges.
Have feedback on this article? Concerned about the content? Get in touch with us directly. Alternatively, email editorial-team (at) simplywallst.com.
This article by Simply Wall St is general in nature. We provide commentary based on historical data and analyst forecasts only using an unbiased methodology and our articles are not intended to be financial advice. It does not constitute a recommendation to buy or sell any stock, and does not take account of your objectives, or your financial situation. We aim to bring you long-term focused analysis driven by fundamental data. Note that our analysis may not factor in the latest price-sensitive company announcements or qualitative material. Simply Wall St has no position in any stocks mentioned.
