
 Yahoo Finance
 The past five years for GEO Group (NYSE:GEO) investors has not been profitable
Generally speaking long term investing is the way to go. But that doesn't mean long term investors can avoid big losses. To wit, the The GEO Group, Inc. (NYSE:GEO) share price managed to fall 66% over five long years. That's not a lot of fun for true believers. The falls have accelerated recently, with the share price down 16% in the last three months. We note that the company has reported results fairly recently; and the market is hardly delighted. You can check out the latest numbers in our company report.
So let's have a look and see if the longer term performance of the company has been in line with the underlying business' progress.
Check out our latest analysis for GEO Group
To paraphrase Benjamin Graham: Over the short term the market is a voting machine, but over the long term it's a weighing machine. One flawed but reasonable way to assess how sentiment around a company has changed is to compare the earnings per share (EPS) with the share price.
During the five years over which the share price declined, GEO Group's earnings per share (EPS) dropped by 1.0% each year. Readers should note that the share price has fallen faster than the EPS, at a rate of 19% per year, over the period. This implies that the market was previously too optimistic about the stock. The low P/E ratio of 7.59 further reflects this reticence.
The image below shows how EPS has tracked over time (if you click on the image you can see greater detail).
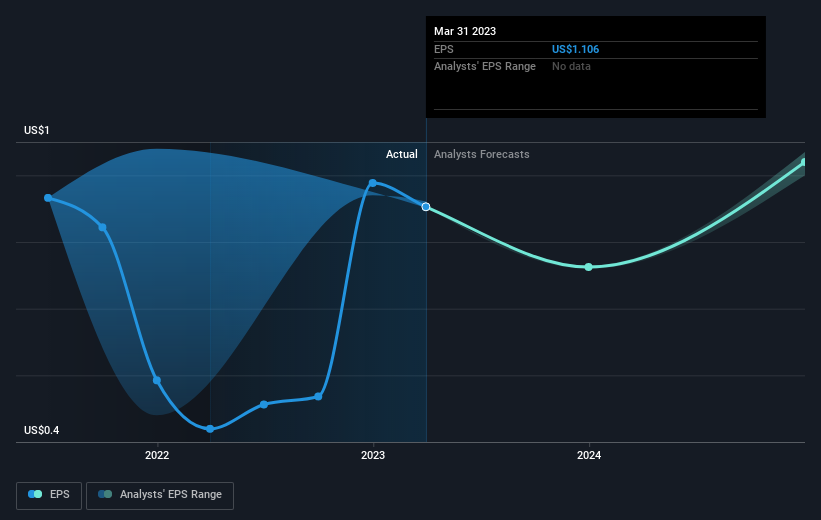
We know that GEO Group has improved its bottom line lately, but is it going to grow revenue? If you're interested, you could check this free report showing consensus revenue forecasts.
What About The Total Shareholder Return (TSR)?
We'd be remiss not to mention the difference between GEO Group's total shareholder return (TSR) and its share price return. The TSR is a return calculation that accounts for the value of cash dividends (assuming that any dividend received was reinvested) and the calculated value of any discounted capital raisings and spin-offs. Its history of dividend payouts mean that GEO Group's TSR, which was a 54% drop over the last 5 years, was not as bad as the share price return.
A Different Perspective
We're pleased to report that GEO Group shareholders have received a total shareholder return of 24% over one year. Notably the five-year annualised TSR loss of 9% per year compares very unfavourably with the recent share price performance. This makes us a little wary, but the business might have turned around its fortunes. While it is well worth considering the different impacts that market conditions can have on the share price, there are other factors that are even more important. Consider risks, for instance. Every company has them, and we've spotted 1 warning sign for GEO Group you should know about.
If you are like me, then you will not want to miss this free list of growing companies that insiders are buying.
Please note, the market returns quoted in this article reflect the market weighted average returns of stocks that currently trade on American exchanges.
Have feedback on this article? Concerned about the content? Get in touch with us directly. Alternatively, email editorial-team (at) simplywallst.com.
This article by Simply Wall St is general in nature. We provide commentary based on historical data and analyst forecasts only using an unbiased methodology and our articles are not intended to be financial advice. It does not constitute a recommendation to buy or sell any stock, and does not take account of your objectives, or your financial situation. We aim to bring you long-term focused analysis driven by fundamental data. Note that our analysis may not factor in the latest price-sensitive company announcements or qualitative material. Simply Wall St has no position in any stocks mentioned.
Join A Paid User Research Session
You’ll receive a US$30 Amazon Gift card for 1 hour of your time while helping us build better investing tools for the individual investors like yourself. Sign up here
