
 Yahoo Finance
 Paragon Care (ASX:PGC) investors are sitting on a loss of 63% if they invested five years ago
We think intelligent long term investing is the way to go. But unfortunately, some companies simply don't succeed. For example the Paragon Care Limited (ASX:PGC) share price dropped 68% over five years. We certainly feel for shareholders who bought near the top. Shareholders have had an even rougher run lately, with the share price down 30% in the last 90 days. Of course, this share price action may well have been influenced by the 14% decline in the broader market, throughout the period.
Since shareholders are down over the longer term, lets look at the underlying fundamentals over the that time and see if they've been consistent with returns.
View our latest analysis for Paragon Care
While the efficient markets hypothesis continues to be taught by some, it has been proven that markets are over-reactive dynamic systems, and investors are not always rational. One way to examine how market sentiment has changed over time is to look at the interaction between a company's share price and its earnings per share (EPS).
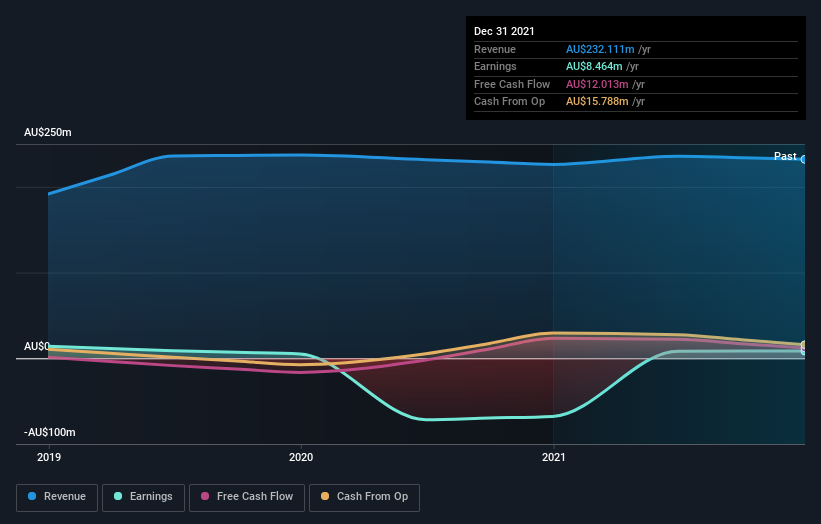
Paragon Care became profitable within the last five years. Most would consider that to be a good thing, so it's counter-intuitive to see the share price declining. Other metrics might give us a better handle on how its value is changing over time.
The most recent dividend was actually lower than it was in the past, so that may have sent the share price lower.
You can see how earnings and revenue have changed over time in the image below (click on the chart to see the exact values).
You can see how its balance sheet has strengthened (or weakened) over time in this free interactive graphic.
What About Dividends?
When looking at investment returns, it is important to consider the difference between total shareholder return (TSR) and share price return. Whereas the share price return only reflects the change in the share price, the TSR includes the value of dividends (assuming they were reinvested) and the benefit of any discounted capital raising or spin-off. So for companies that pay a generous dividend, the TSR is often a lot higher than the share price return. As it happens, Paragon Care's TSR for the last 5 years was -63%, which exceeds the share price return mentioned earlier. This is largely a result of its dividend payments!
A Different Perspective
While it's never nice to take a loss, Paragon Care shareholders can take comfort that , including dividends,their trailing twelve month loss of 4.3% wasn't as bad as the market loss of around 5.5%. What is more upsetting is the 10% per annum loss investors have suffered over the last half decade. This sort of share price action isn't particularly encouraging, but at least the losses are slowing. While it is well worth considering the different impacts that market conditions can have on the share price, there are other factors that are even more important. Consider for instance, the ever-present spectre of investment risk. We've identified 4 warning signs with Paragon Care (at least 2 which are potentially serious) , and understanding them should be part of your investment process.
But note: Paragon Care may not be the best stock to buy. So take a peek at this free list of interesting companies with past earnings growth (and further growth forecast).
Please note, the market returns quoted in this article reflect the market weighted average returns of stocks that currently trade on AU exchanges.
Have feedback on this article? Concerned about the content? Get in touch with us directly. Alternatively, email editorial-team (at) simplywallst.com.
This article by Simply Wall St is general in nature. We provide commentary based on historical data and analyst forecasts only using an unbiased methodology and our articles are not intended to be financial advice. It does not constitute a recommendation to buy or sell any stock, and does not take account of your objectives, or your financial situation. We aim to bring you long-term focused analysis driven by fundamental data. Note that our analysis may not factor in the latest price-sensitive company announcements or qualitative material. Simply Wall St has no position in any stocks mentioned.
Join A Paid User Research Session
You’ll receive a US$30 Amazon Gift card for 1 hour of your time while helping us build better investing tools for the individual investors like yourself. Sign up here
