
 Yahoo Finance
 Panther Securities (LON:PNS) shareholders have earned a 1.3% CAGR over the last five years
For many, the main point of investing is to generate higher returns than the overall market. But even the best stock picker will only win with some selections. At this point some shareholders may be questioning their investment in Panther Securities PLC (LON:PNS), since the last five years saw the share price fall 16%.
So let's have a look and see if the longer term performance of the company has been in line with the underlying business' progress.
See our latest analysis for Panther Securities
While the efficient markets hypothesis continues to be taught by some, it has been proven that markets are over-reactive dynamic systems, and investors are not always rational. One way to examine how market sentiment has changed over time is to look at the interaction between a company's share price and its earnings per share (EPS).
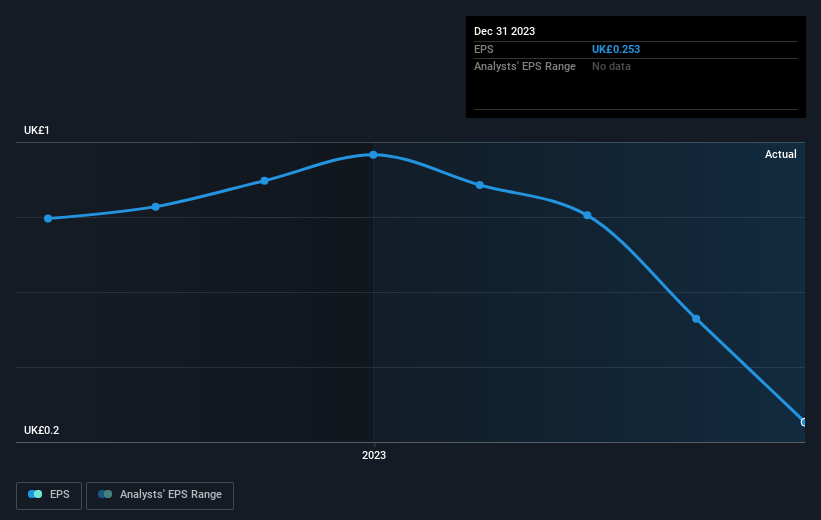
During the five years over which the share price declined, Panther Securities' earnings per share (EPS) dropped by 8.6% each year. This fall in the EPS is worse than the 4% compound annual share price fall. The relatively muted share price reaction might be because the market expects the business to turn around.
The image below shows how EPS has tracked over time (if you click on the image you can see greater detail).
We're pleased to report that the CEO is remunerated more modestly than most CEOs at similarly capitalized companies. It's always worth keeping an eye on CEO pay, but a more important question is whether the company will grow earnings throughout the years. Dive deeper into the earnings by checking this interactive graph of Panther Securities' earnings, revenue and cash flow.
What About Dividends?
As well as measuring the share price return, investors should also consider the total shareholder return (TSR). The TSR incorporates the value of any spin-offs or discounted capital raisings, along with any dividends, based on the assumption that the dividends are reinvested. It's fair to say that the TSR gives a more complete picture for stocks that pay a dividend. As it happens, Panther Securities' TSR for the last 5 years was 6.4%, which exceeds the share price return mentioned earlier. This is largely a result of its dividend payments!
A Different Perspective
Panther Securities shareholders gained a total return of 5.9% during the year. But that return falls short of the market. On the bright side, that's still a gain, and it's actually better than the average return of 1.3% over half a decade It is possible that returns will improve along with the business fundamentals. I find it very interesting to look at share price over the long term as a proxy for business performance. But to truly gain insight, we need to consider other information, too. Case in point: We've spotted 5 warning signs for Panther Securities you should be aware of, and 1 of them makes us a bit uncomfortable.
If you would prefer to check out another company -- one with potentially superior financials -- then do not miss this free list of companies that have proven they can grow earnings.
Please note, the market returns quoted in this article reflect the market weighted average returns of stocks that currently trade on British exchanges.
Have feedback on this article? Concerned about the content? Get in touch with us directly. Alternatively, email editorial-team (at) simplywallst.com.
This article by Simply Wall St is general in nature. We provide commentary based on historical data and analyst forecasts only using an unbiased methodology and our articles are not intended to be financial advice. It does not constitute a recommendation to buy or sell any stock, and does not take account of your objectives, or your financial situation. We aim to bring you long-term focused analysis driven by fundamental data. Note that our analysis may not factor in the latest price-sensitive company announcements or qualitative material. Simply Wall St has no position in any stocks mentioned.
