
 Yahoo Finance
 S&P Global (SPGI) Beats on Q3 Earnings & Revenues, Ups View
S&P Global Inc. SPGI reported better-than-expected third-quarter 2021 results.
Adjusted earnings per share of $3.54 beat the consensus mark by 11.3% and improved 24.2% year over year on the back of solid revenue growth. Revenues of $2.09 billion beat the consensus estimate by 4.5% and improved 13% year over year, backed by strength across every segment.
So far this year, shares of S&P Global have gained 36.1% compared with 17.8% surge of the industry it belongs to and 22% rise of the Zacks S&P 500 composite.
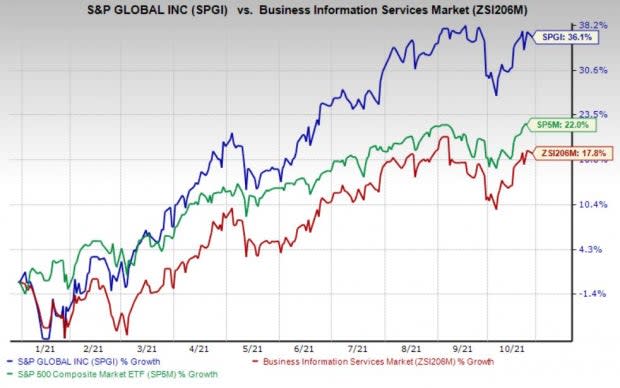
Image Source: Zacks Investment Research
Let’s check out the numbers in detail.
Segmental Revenues
Ratings revenues increased 14% year over year to $1.02 billion. Transaction revenues grew 13% to $551 million, backed by gains in bank loan rating activity and structured finance, which offset declines in corporate bond issuance. Non-transaction revenues grew 15% to $466 million, owing to fees associated with surveillance, new-entity ratings, and Rating Evaluation Service activity.
Market Intelligence revenues were up 7% year over year to $570 million, primarily driven by growth in Data Management Solutions, Credit Risk Solutions and Desktop.
Platts revenues rose 8% year over year to $239 million, backed by growth in core subscription business.
S&P Dow Jones Indices revenues grew 28% to $298 million, backed by strength across asset-linked fees and exchange-traded derivative activity.
Operating Results
Adjusted operating profit margin grew 8% year over year to $1.23 billion. Adjusted operating profit margin increased 250 basis points (bps) to 55.4%, owing to higher incremental profits on additional revenue.
Segment wise, Ratings’ adjusted operating profit improved 17% to $645 million while adjusted operating profit margin increased 160 bps to 63.4%.
Market Intelligence’s adjusted operating profit increased 13% to $203 million and adjusted operating profit margin improved 190 bps to 35.7%.
Platts’ adjusted operating profit increased 5% to $130 million and adjusted operating profit margin decreased 110 bps to 54.6%.
S&P Dow Jones’ adjusted operating profit increased 40% to $214 million. Adjusted operating profit margin increased 660 bps to 71.8%.
S&P Global Inc. Price, Consensus and EPS Surprise
S&P Global Inc. price-consensus-eps-surprise-chart | S&P Global Inc. Quote
Balance Sheet and Cash Flow
S&P Global exited third-quarter 2021 with cash, cash equivalents and restricted cash of $5.91 billion compared with $5.22 billion at the end of the prior quarter. Long-term debt was $4.11 billion, flat sequentially.
The company generated $967 million of cash from operating activities in the reported quarter. Capital expenditures were $8 million. Free cash flow was $906 million.
During the reported quarter, S&P Global returned $186 million to shareholders in the form of dividend payment. However, it did not repurchase any share during the quarter due to the pending merger with IHS Markit.
2021 Guidance
S&P Global raised its full-year 2021 guidance. The company now expects adjusted EPS in the range of $13.5-$13.65 compared with the prior guidance of $12.95-$13.15. The current Zacks Consensus Estimate of $13.18 lies below the updated guidance.
Free cash flow is anticipated between $3.6 billion and $3.7 billion compared with the prior guidance of $3.5-$3.6 billion. Revenues are anticipated to increase low double-digits.
Currently, S&P Global carries a Zacks Rank #3 (Hold). You can see the complete list of today’s Zacks #1 Rank (Strong Buy) stocks here.
Performance of Other Business Services Companies
Equifax’s EFX third-quarter 2021 adjusted earnings of $1.85 per share beat the Zacks Consensus Estimate by 7.6% but declined on a year-over-year basis. Revenues of $1.22 billion outpaced the consensus estimate by 3.6% and improved 14.5% year over year on a reported basis and 14% on a local-currency basis.
IQVIA’s IQV third-quarter 2021 adjusted earnings per share of $2.17 beat the consensus mark by 1.9% and improved 33.1% on a year-over-year basis. Total revenues of $3.39 billion outpaced the consensus estimate by 1% and increased 21.7% year over year on a reported basis and 21.1% on constant-currency basis.
Omnicom’sOMC third-quarter 2021 adjusted earnings of $1.65 per share that beat the consensus mark by 20.4% and increased 36.4% year over year. Total revenues of $3.4 billion surpassed the consensus estimate by 0.6% and increased 7.1% year over year.
Want the latest recommendations from Zacks Investment Research? Today, you can download 7 Best Stocks for the Next 30 Days. Click to get this free report
Omnicom Group Inc. (OMC) : Free Stock Analysis Report
Equifax, Inc. (EFX) : Free Stock Analysis Report
S&P Global Inc. (SPGI) : Free Stock Analysis Report
IQVIA Holdings Inc. (IQV) : Free Stock Analysis Report
To read this article on Zacks.com click here.
Zacks Investment Research
