
 Yahoo Finance
 S&P/ASX 200 Technical Analysis: Repeated Rejection at Triple Top
DailyFX.com -
Talking Points:
ASX200 Strategy: range trade with the current downturn
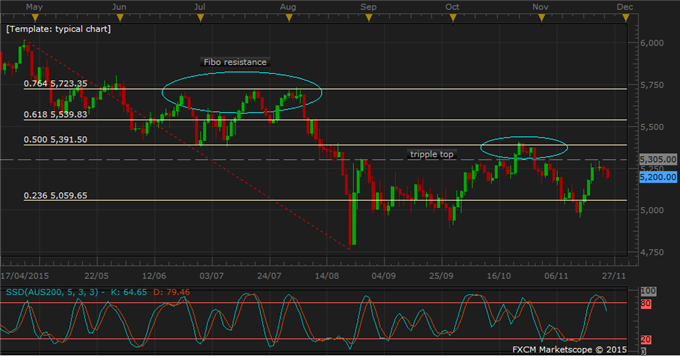
Triple top formed at 5305 as price retracted this week, again
Crowded resistance region above head: 50% Fibonacci, 76.4% Fibonacci (also a triple top)
The S&P/ASX 200 declined for a second day and currently trades near a daily low at 5192.1. Last week’s swift rise stopped short of 5305 resistance level again – which made it a triple top, after similar halts in August and October.
Above that, 50% Fibonacci of the April-August descent at 5391.5 acts as a firm resistance level where prices also halted on October 23-26 (circled). A successful break through this would lead to a higher triple top and 76.4% Fibonacci at 5723.3 (circled). The bulls should keep these resistance levels in check to possibly adjust their stops and targets.
Range traders may find short-term opportunities during this downturn, with a potential target around 23.6% Fibonacci at 5059.6 or the previous bottom at 4958. Daily momentum signals (shown in lower panel) have also turned down, a sign that this reversal is gathering strength.
Losing Money Trading Forex?This Might Be Why.
DailyFX provides forex news and technical analysis on the trends that influence the global currency markets.
Learn forex trading with a free practice account and trading charts from FXCM.
