
 Yahoo Finance
 S&P 500 and Nasdaq 100 Short-term Trading Levels
DailyFX.com -
What’s inside:
The S&P 500 sells off from resistance, looking to support levels
The Nasdaq 100 takes a hit below support, Aamzon and Google reported earnings
U.S. GDP/Personal Consumption data due out at 12:30 GMT, could be chart altering
S&P 500
Yesterday, shortly off the open the S&P 500 turned sharply lower from the staunch resistance zone we had penciled in at 2146/50 (2147 was the day high). This quickly brought into play support by way of a trend-line off the 10/13 low, as well as a lower parallel running back to the 10/17 swing low. The market closed just beneath these nearly intersecting levels of support, which puts the area right around 2130 into focus. A clean break of 2130 clears a path to 2124 (a lower parallel also lies in this area) and then the key daily swing low at 2115.
If support levels hold, we’ll turn our attention towards a minor trend-line starting from Monday and then the 2146/48 area where lies horizontal resistance and the trend-line off the 10/10 swing high. Above key resistance, 2155 and the major trend-line off the 9/7 peak come into view.
S&P 500: Hourly

Created with Tradingview
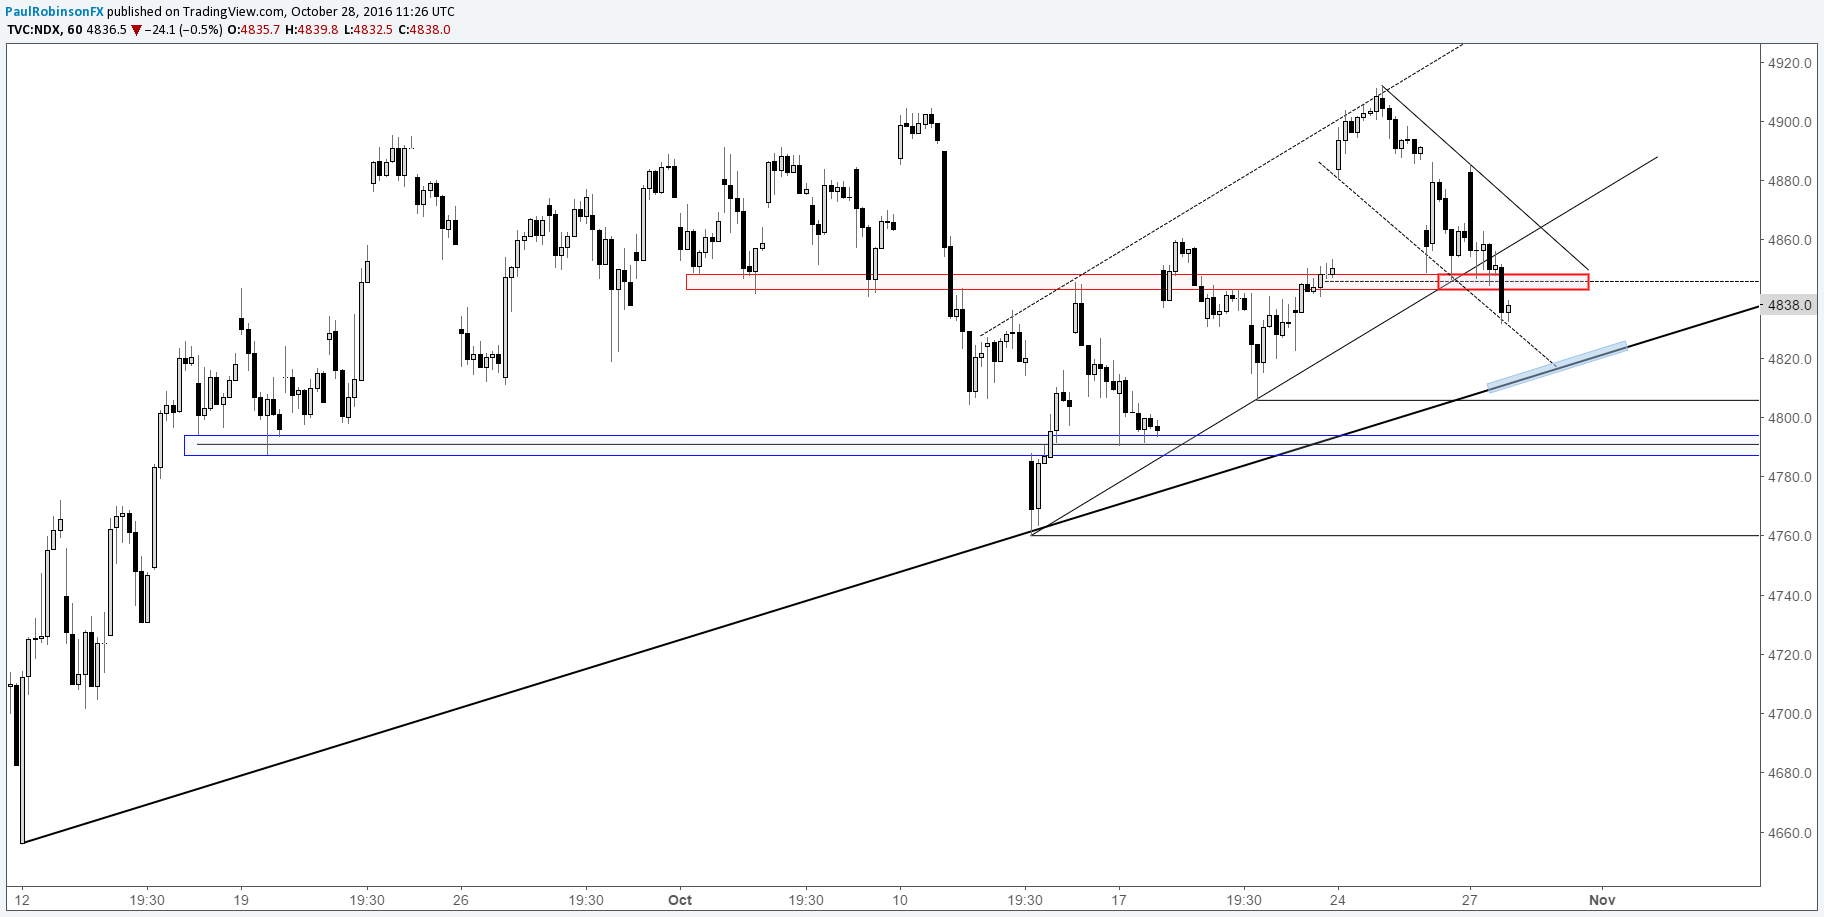
Nasdaq 100
The Nasdaq 100 dropped below the lower parallel of the channel rising up from the 10/13 swing low, and in the process, it also took out important horizontal support dating back to the beginning of the month. This area in the 4342/48 vicinity is now viewed as a fairly substantial zone of resistance should the market rally to that point. The descending parallels off Monday’s high will become a factor as well, but how they do so will depend on where the market opens. The lower parallel is viewed as a minor form of support and a more substantial area of resistance at the upper parallel given the short-term trend is pointed lower.
Support currently comes in at the trend-line rising up from the 9/12 swing low. Amazon (AMZN) reported earnings right after yesterday’s closing bell, selling off sharply (-5% in early pre-market this morning) and also hitting the Nasdaq futures by about 25 handles in the process from the 20:00 GMT cash close to the 20:15 close in futures. Google (GOOG/GOOGL) beat on earnings, but only saw a modest pop (higher by a little more than 1% in pre-market). So, there will likely be a gap towards the 9/12 trend-line once the cash session opens, barring a jump on U.S. data. A break below the 9/12 trend-line would be meaningful, bringing into play the 10/20 swing low at 4806, then ~4790, and finally 4760 with aggressive selling pressure.
Nasdaq 100: Hourly
Created with Tradingview
At this time, the S&Ps are trading higher by 3.5 while the Nasdaq futures are up 4.5 from the 20:15 GMT futures close. At 12:30, we have GDP and Personal Consumption figures; consensus estimates are for annualized growth rates of 2.5% and 2.6%, respectively. Depending on the outcome, the market could open beyond levels outlined. We’ll adjust accordingly (i.e. an open below support will turn former support into new resistance and vice versa).
Check out our Q4 Forecasts and Trading Guides.
---Written by Paul Robinson, Market Analyst
To receive Paul’s analysis directly via email, please sign up here.
You can follow Paul on Twitter at @PaulRobinonFX.
DailyFX provides forex news and technical analysis on the trends that influence the global currency markets.
Learn forex trading with a free practice account and trading charts from FXCM.
